Canadian vs Immigrants from Bolivia Male Poverty
COMPARE
Canadian
Immigrants from Bolivia
Male Poverty
Male Poverty Comparison
Canadians
Immigrants from Bolivia
10.5%
MALE POVERTY
91.6/ 100
METRIC RATING
105th/ 347
METRIC RANK
9.4%
MALE POVERTY
99.9/ 100
METRIC RATING
12th/ 347
METRIC RANK
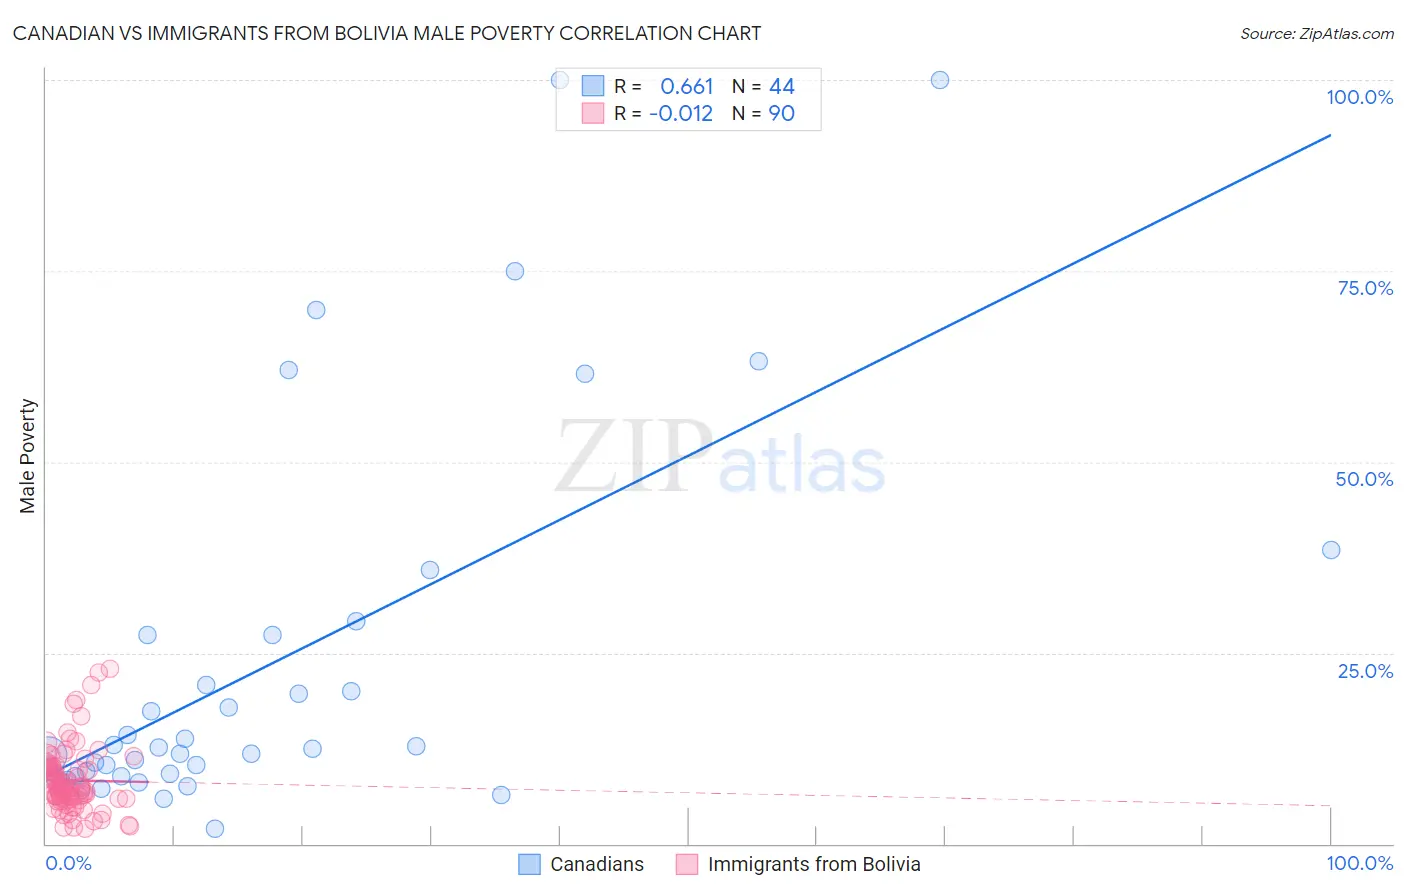
Canadian vs Immigrants from Bolivia Male Poverty Correlation Chart
The statistical analysis conducted on geographies consisting of 437,032,660 people shows a significant positive correlation between the proportion of Canadians and poverty level among males in the United States with a correlation coefficient (R) of 0.661 and weighted average of 10.5%. Similarly, the statistical analysis conducted on geographies consisting of 158,688,041 people shows no correlation between the proportion of Immigrants from Bolivia and poverty level among males in the United States with a correlation coefficient (R) of -0.012 and weighted average of 9.4%, a difference of 12.2%.
Male Poverty Correlation Summary
| Measurement | Canadian | Immigrants from Bolivia |
| Minimum | 2.0% | 2.0% |
| Maximum | 100.0% | 22.9% |
| Range | 98.0% | 20.9% |
| Mean | 23.8% | 8.3% |
| Median | 12.5% | 7.3% |
| Interquartile 25% (IQ1) | 8.8% | 5.9% |
| Interquartile 75% (IQ3) | 27.3% | 10.1% |
| Interquartile Range (IQR) | 18.5% | 4.2% |
| Standard Deviation (Sample) | 25.0% | 4.3% |
| Standard Deviation (Population) | 24.7% | 4.2% |
Similar Demographics by Male Poverty
Demographics Similar to Canadians by Male Poverty
In terms of male poverty, the demographic groups most similar to Canadians are Welsh (10.5%, a difference of 0.010%), Slavic (10.5%, a difference of 0.020%), Immigrants from Southern Europe (10.5%, a difference of 0.11%), French Canadian (10.5%, a difference of 0.12%), and Laotian (10.5%, a difference of 0.12%).
| Demographics | Rating | Rank | Male Poverty |
| Finns | 93.4 /100 | #98 | Exceptional 10.5% |
| Immigrants | Indonesia | 93.3 /100 | #99 | Exceptional 10.5% |
| Immigrants | Latvia | 92.8 /100 | #100 | Exceptional 10.5% |
| Immigrants | Zimbabwe | 92.0 /100 | #101 | Exceptional 10.5% |
| French Canadians | 91.9 /100 | #102 | Exceptional 10.5% |
| Slavs | 91.7 /100 | #103 | Exceptional 10.5% |
| Welsh | 91.6 /100 | #104 | Exceptional 10.5% |
| Canadians | 91.6 /100 | #105 | Exceptional 10.5% |
| Immigrants | Southern Europe | 91.3 /100 | #106 | Exceptional 10.5% |
| Laotians | 91.2 /100 | #107 | Exceptional 10.5% |
| Portuguese | 91.0 /100 | #108 | Exceptional 10.6% |
| Albanians | 90.6 /100 | #109 | Exceptional 10.6% |
| Argentineans | 90.1 /100 | #110 | Exceptional 10.6% |
| Immigrants | Argentina | 89.8 /100 | #111 | Excellent 10.6% |
| Immigrants | Turkey | 89.5 /100 | #112 | Excellent 10.6% |
Demographics Similar to Immigrants from Bolivia by Male Poverty
In terms of male poverty, the demographic groups most similar to Immigrants from Bolivia are Bolivian (9.4%, a difference of 0.050%), Immigrants from Lithuania (9.4%, a difference of 0.12%), Immigrants from North Macedonia (9.4%, a difference of 0.50%), Bulgarian (9.3%, a difference of 0.69%), and Bhutanese (9.5%, a difference of 0.79%).
| Demographics | Rating | Rank | Male Poverty |
| Maltese | 100.0 /100 | #5 | Exceptional 9.1% |
| Assyrians/Chaldeans/Syriacs | 99.9 /100 | #6 | Exceptional 9.1% |
| Immigrants | Ireland | 99.9 /100 | #7 | Exceptional 9.1% |
| Filipinos | 99.9 /100 | #8 | Exceptional 9.2% |
| Immigrants | South Central Asia | 99.9 /100 | #9 | Exceptional 9.3% |
| Bulgarians | 99.9 /100 | #10 | Exceptional 9.3% |
| Bolivians | 99.9 /100 | #11 | Exceptional 9.4% |
| Immigrants | Bolivia | 99.9 /100 | #12 | Exceptional 9.4% |
| Immigrants | Lithuania | 99.9 /100 | #13 | Exceptional 9.4% |
| Immigrants | North Macedonia | 99.8 /100 | #14 | Exceptional 9.4% |
| Bhutanese | 99.8 /100 | #15 | Exceptional 9.5% |
| Luxembourgers | 99.8 /100 | #16 | Exceptional 9.5% |
| Norwegians | 99.8 /100 | #17 | Exceptional 9.5% |
| Lithuanians | 99.8 /100 | #18 | Exceptional 9.5% |
| Immigrants | Hong Kong | 99.7 /100 | #19 | Exceptional 9.6% |