Japanese vs Immigrants from Bolivia Male Poverty
COMPARE
Japanese
Immigrants from Bolivia
Male Poverty
Male Poverty Comparison
Japanese
Immigrants from Bolivia
12.2%
MALE POVERTY
2.7/ 100
METRIC RATING
214th/ 347
METRIC RANK
9.4%
MALE POVERTY
99.9/ 100
METRIC RATING
12th/ 347
METRIC RANK
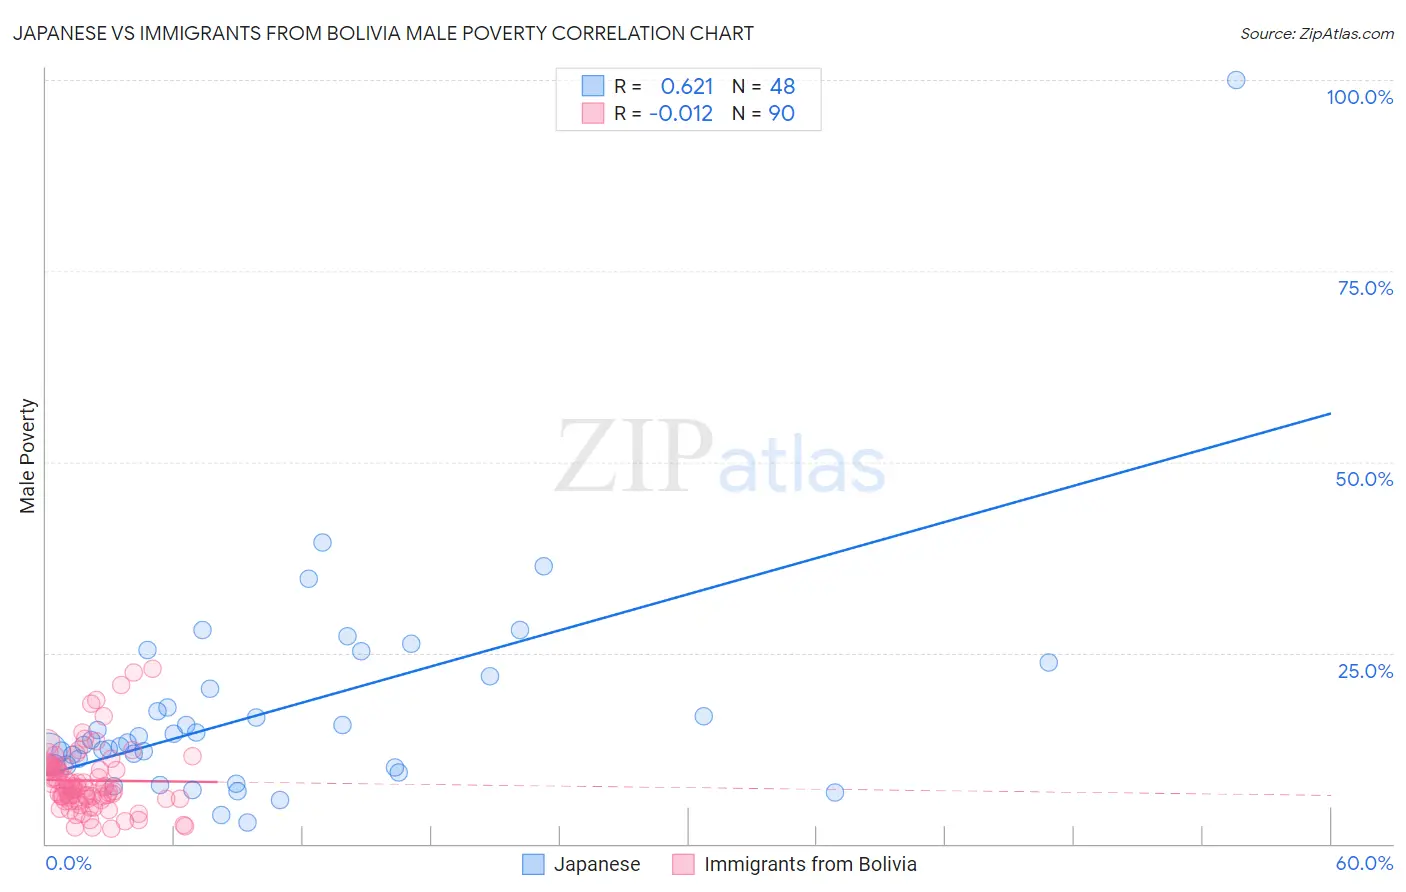
Japanese vs Immigrants from Bolivia Male Poverty Correlation Chart
The statistical analysis conducted on geographies consisting of 249,058,138 people shows a significant positive correlation between the proportion of Japanese and poverty level among males in the United States with a correlation coefficient (R) of 0.621 and weighted average of 12.2%. Similarly, the statistical analysis conducted on geographies consisting of 158,688,041 people shows no correlation between the proportion of Immigrants from Bolivia and poverty level among males in the United States with a correlation coefficient (R) of -0.012 and weighted average of 9.4%, a difference of 29.6%.
Male Poverty Correlation Summary
| Measurement | Japanese | Immigrants from Bolivia |
| Minimum | 2.8% | 2.0% |
| Maximum | 100.0% | 22.9% |
| Range | 97.2% | 20.9% |
| Mean | 17.5% | 8.3% |
| Median | 13.3% | 7.3% |
| Interquartile 25% (IQ1) | 10.3% | 5.9% |
| Interquartile 75% (IQ3) | 21.2% | 10.1% |
| Interquartile Range (IQR) | 10.9% | 4.2% |
| Standard Deviation (Sample) | 14.8% | 4.3% |
| Standard Deviation (Population) | 14.6% | 4.2% |
Similar Demographics by Male Poverty
Demographics Similar to Japanese by Male Poverty
In terms of male poverty, the demographic groups most similar to Japanese are Immigrants from Uzbekistan (12.2%, a difference of 0.12%), Immigrants from Cambodia (12.2%, a difference of 0.20%), Immigrants from Thailand (12.2%, a difference of 0.21%), German Russian (12.2%, a difference of 0.23%), and Bermudan (12.2%, a difference of 0.30%).
| Demographics | Rating | Rank | Male Poverty |
| Malaysians | 5.2 /100 | #207 | Tragic 12.0% |
| Immigrants | Immigrants | 4.5 /100 | #208 | Tragic 12.0% |
| Immigrants | Azores | 4.3 /100 | #209 | Tragic 12.0% |
| Moroccans | 4.2 /100 | #210 | Tragic 12.0% |
| Immigrants | Panama | 4.0 /100 | #211 | Tragic 12.1% |
| Americans | 3.2 /100 | #212 | Tragic 12.1% |
| Immigrants | Nonimmigrants | 3.1 /100 | #213 | Tragic 12.1% |
| Japanese | 2.7 /100 | #214 | Tragic 12.2% |
| Immigrants | Uzbekistan | 2.6 /100 | #215 | Tragic 12.2% |
| Immigrants | Cambodia | 2.5 /100 | #216 | Tragic 12.2% |
| Immigrants | Thailand | 2.5 /100 | #217 | Tragic 12.2% |
| German Russians | 2.5 /100 | #218 | Tragic 12.2% |
| Bermudans | 2.4 /100 | #219 | Tragic 12.2% |
| Immigrants | Eritrea | 2.4 /100 | #220 | Tragic 12.2% |
| Ugandans | 2.2 /100 | #221 | Tragic 12.2% |
Demographics Similar to Immigrants from Bolivia by Male Poverty
In terms of male poverty, the demographic groups most similar to Immigrants from Bolivia are Bolivian (9.4%, a difference of 0.050%), Immigrants from Lithuania (9.4%, a difference of 0.12%), Immigrants from North Macedonia (9.4%, a difference of 0.50%), Bulgarian (9.3%, a difference of 0.69%), and Bhutanese (9.5%, a difference of 0.79%).
| Demographics | Rating | Rank | Male Poverty |
| Maltese | 100.0 /100 | #5 | Exceptional 9.1% |
| Assyrians/Chaldeans/Syriacs | 99.9 /100 | #6 | Exceptional 9.1% |
| Immigrants | Ireland | 99.9 /100 | #7 | Exceptional 9.1% |
| Filipinos | 99.9 /100 | #8 | Exceptional 9.2% |
| Immigrants | South Central Asia | 99.9 /100 | #9 | Exceptional 9.3% |
| Bulgarians | 99.9 /100 | #10 | Exceptional 9.3% |
| Bolivians | 99.9 /100 | #11 | Exceptional 9.4% |
| Immigrants | Bolivia | 99.9 /100 | #12 | Exceptional 9.4% |
| Immigrants | Lithuania | 99.9 /100 | #13 | Exceptional 9.4% |
| Immigrants | North Macedonia | 99.8 /100 | #14 | Exceptional 9.4% |
| Bhutanese | 99.8 /100 | #15 | Exceptional 9.5% |
| Luxembourgers | 99.8 /100 | #16 | Exceptional 9.5% |
| Norwegians | 99.8 /100 | #17 | Exceptional 9.5% |
| Lithuanians | 99.8 /100 | #18 | Exceptional 9.5% |
| Immigrants | Hong Kong | 99.7 /100 | #19 | Exceptional 9.6% |