Shoshone vs Immigrants from Bolivia Male Poverty
COMPARE
Shoshone
Immigrants from Bolivia
Male Poverty
Male Poverty Comparison
Shoshone
Immigrants from Bolivia
13.8%
MALE POVERTY
0.0/ 100
METRIC RATING
286th/ 347
METRIC RANK
9.4%
MALE POVERTY
99.9/ 100
METRIC RATING
12th/ 347
METRIC RANK
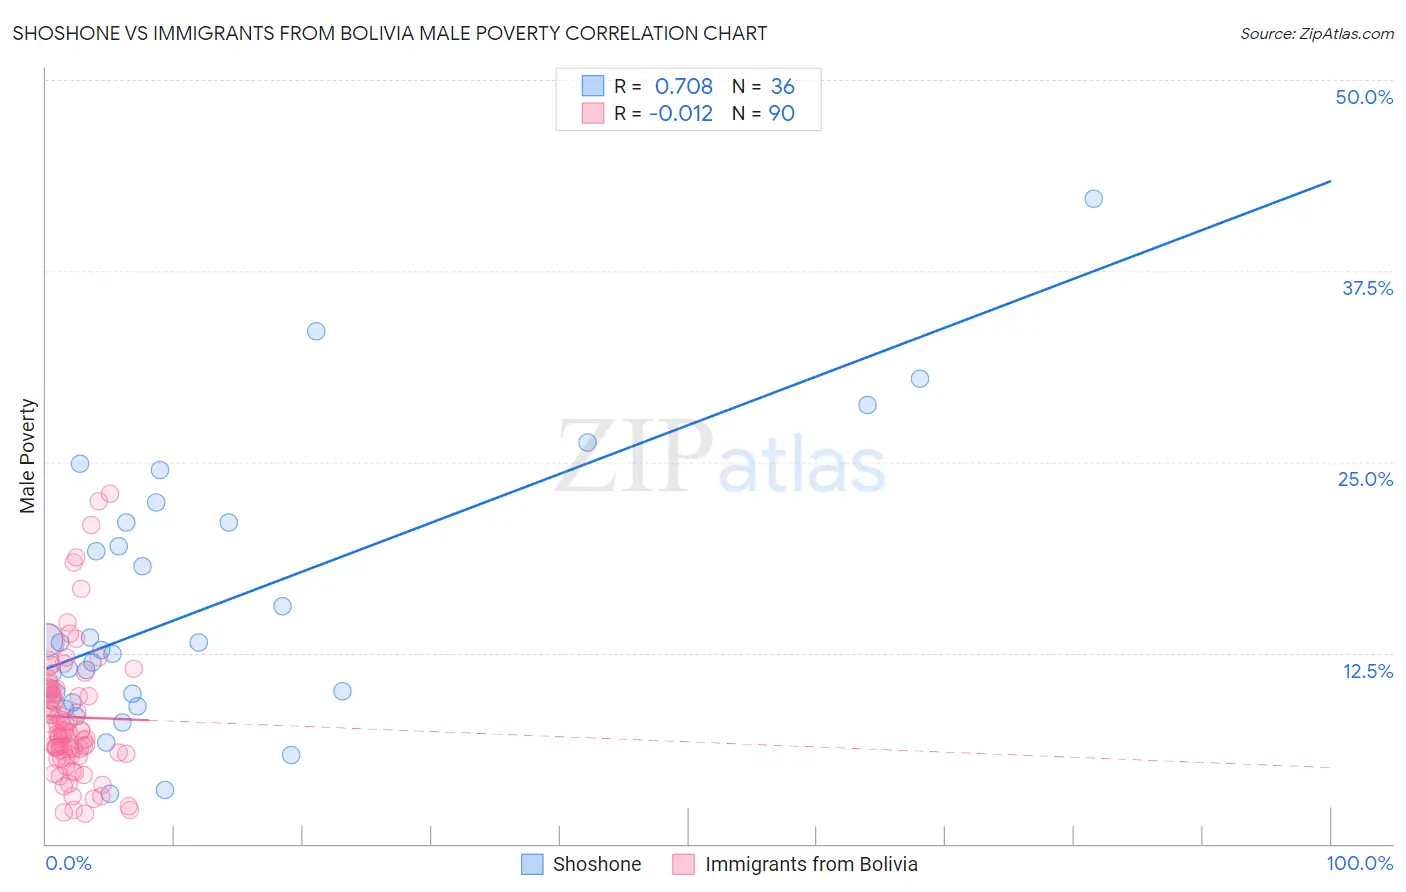
Shoshone vs Immigrants from Bolivia Male Poverty Correlation Chart
The statistical analysis conducted on geographies consisting of 66,615,440 people shows a strong positive correlation between the proportion of Shoshone and poverty level among males in the United States with a correlation coefficient (R) of 0.708 and weighted average of 13.8%. Similarly, the statistical analysis conducted on geographies consisting of 158,688,041 people shows no correlation between the proportion of Immigrants from Bolivia and poverty level among males in the United States with a correlation coefficient (R) of -0.012 and weighted average of 9.4%, a difference of 46.5%.
Male Poverty Correlation Summary
| Measurement | Shoshone | Immigrants from Bolivia |
| Minimum | 3.3% | 2.0% |
| Maximum | 42.2% | 22.9% |
| Range | 38.9% | 20.9% |
| Mean | 15.7% | 8.3% |
| Median | 12.9% | 7.3% |
| Interquartile 25% (IQ1) | 9.5% | 5.9% |
| Interquartile 75% (IQ3) | 21.1% | 10.1% |
| Interquartile Range (IQR) | 11.5% | 4.2% |
| Standard Deviation (Sample) | 8.9% | 4.3% |
| Standard Deviation (Population) | 8.8% | 4.2% |
Similar Demographics by Male Poverty
Demographics Similar to Shoshone by Male Poverty
In terms of male poverty, the demographic groups most similar to Shoshone are Immigrants from Barbados (13.8%, a difference of 0.020%), West Indian (13.8%, a difference of 0.030%), Immigrants from Haiti (13.8%, a difference of 0.040%), Comanche (13.8%, a difference of 0.050%), and Immigrants from St. Vincent and the Grenadines (13.8%, a difference of 0.18%).
| Demographics | Rating | Rank | Male Poverty |
| Haitians | 0.0 /100 | #279 | Tragic 13.7% |
| Mexicans | 0.0 /100 | #280 | Tragic 13.7% |
| Yaqui | 0.0 /100 | #281 | Tragic 13.7% |
| Immigrants | Cabo Verde | 0.0 /100 | #282 | Tragic 13.7% |
| Comanche | 0.0 /100 | #283 | Tragic 13.8% |
| Immigrants | Haiti | 0.0 /100 | #284 | Tragic 13.8% |
| West Indians | 0.0 /100 | #285 | Tragic 13.8% |
| Shoshone | 0.0 /100 | #286 | Tragic 13.8% |
| Immigrants | Barbados | 0.0 /100 | #287 | Tragic 13.8% |
| Immigrants | St. Vincent and the Grenadines | 0.0 /100 | #288 | Tragic 13.8% |
| Guatemalans | 0.0 /100 | #289 | Tragic 13.8% |
| Immigrants | Zaire | 0.0 /100 | #290 | Tragic 13.8% |
| Vietnamese | 0.0 /100 | #291 | Tragic 13.8% |
| Indonesians | 0.0 /100 | #292 | Tragic 13.8% |
| Immigrants | Belize | 0.0 /100 | #293 | Tragic 13.8% |
Demographics Similar to Immigrants from Bolivia by Male Poverty
In terms of male poverty, the demographic groups most similar to Immigrants from Bolivia are Bolivian (9.4%, a difference of 0.050%), Immigrants from Lithuania (9.4%, a difference of 0.12%), Immigrants from North Macedonia (9.4%, a difference of 0.50%), Bulgarian (9.3%, a difference of 0.69%), and Bhutanese (9.5%, a difference of 0.79%).
| Demographics | Rating | Rank | Male Poverty |
| Maltese | 100.0 /100 | #5 | Exceptional 9.1% |
| Assyrians/Chaldeans/Syriacs | 99.9 /100 | #6 | Exceptional 9.1% |
| Immigrants | Ireland | 99.9 /100 | #7 | Exceptional 9.1% |
| Filipinos | 99.9 /100 | #8 | Exceptional 9.2% |
| Immigrants | South Central Asia | 99.9 /100 | #9 | Exceptional 9.3% |
| Bulgarians | 99.9 /100 | #10 | Exceptional 9.3% |
| Bolivians | 99.9 /100 | #11 | Exceptional 9.4% |
| Immigrants | Bolivia | 99.9 /100 | #12 | Exceptional 9.4% |
| Immigrants | Lithuania | 99.9 /100 | #13 | Exceptional 9.4% |
| Immigrants | North Macedonia | 99.8 /100 | #14 | Exceptional 9.4% |
| Bhutanese | 99.8 /100 | #15 | Exceptional 9.5% |
| Luxembourgers | 99.8 /100 | #16 | Exceptional 9.5% |
| Norwegians | 99.8 /100 | #17 | Exceptional 9.5% |
| Lithuanians | 99.8 /100 | #18 | Exceptional 9.5% |
| Immigrants | Hong Kong | 99.7 /100 | #19 | Exceptional 9.6% |