Canadian vs Immigrants from Bolivia Unemployment Among Ages 20 to 24 years
COMPARE
Canadian
Immigrants from Bolivia
Unemployment Among Ages 20 to 24 years
Unemployment Among Ages 20 to 24 years Comparison
Canadians
Immigrants from Bolivia
10.2%
UNEMPLOYMENT AMONG AGES 20 TO 24 YEARS
66.7/ 100
METRIC RATING
156th/ 347
METRIC RANK
9.9%
UNEMPLOYMENT AMONG AGES 20 TO 24 YEARS
99.2/ 100
METRIC RATING
67th/ 347
METRIC RANK
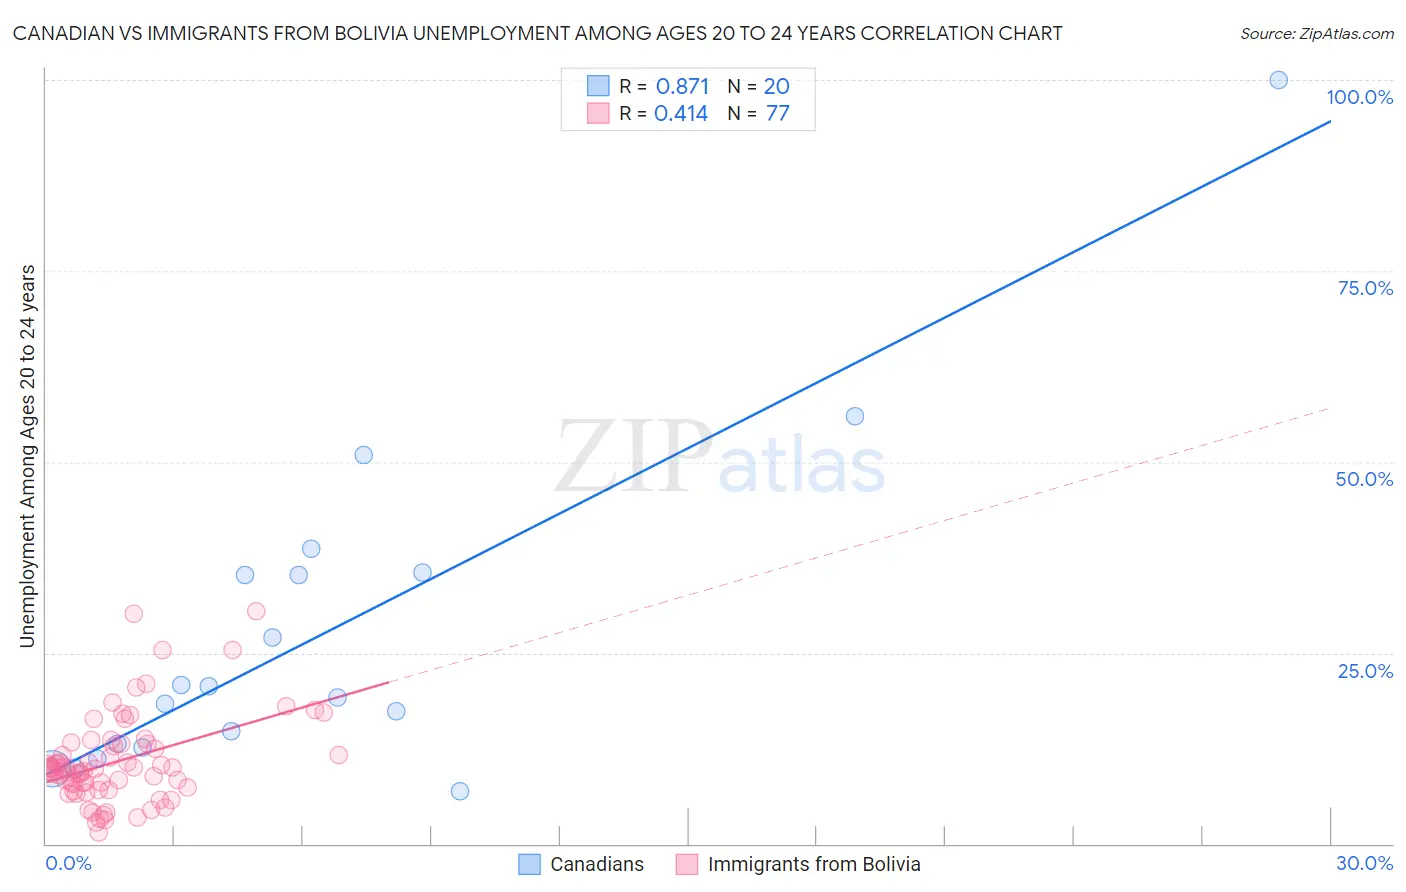
Canadian vs Immigrants from Bolivia Unemployment Among Ages 20 to 24 years Correlation Chart
The statistical analysis conducted on geographies consisting of 418,300,570 people shows a very strong positive correlation between the proportion of Canadians and unemployment rate among population between the ages 20 and 24 in the United States with a correlation coefficient (R) of 0.871 and weighted average of 10.2%. Similarly, the statistical analysis conducted on geographies consisting of 156,989,596 people shows a moderate positive correlation between the proportion of Immigrants from Bolivia and unemployment rate among population between the ages 20 and 24 in the United States with a correlation coefficient (R) of 0.414 and weighted average of 9.9%, a difference of 4.0%.
Unemployment Among Ages 20 to 24 years Correlation Summary
| Measurement | Canadian | Immigrants from Bolivia |
| Minimum | 6.9% | 1.5% |
| Maximum | 100.0% | 30.5% |
| Range | 93.1% | 29.0% |
| Mean | 27.6% | 10.8% |
| Median | 19.9% | 9.8% |
| Interquartile 25% (IQ1) | 12.9% | 7.2% |
| Interquartile 75% (IQ3) | 35.4% | 13.1% |
| Interquartile Range (IQR) | 22.5% | 5.9% |
| Standard Deviation (Sample) | 22.0% | 5.8% |
| Standard Deviation (Population) | 21.4% | 5.8% |
Similar Demographics by Unemployment Among Ages 20 to 24 years
Demographics Similar to Canadians by Unemployment Among Ages 20 to 24 years
In terms of unemployment among ages 20 to 24 years, the demographic groups most similar to Canadians are Immigrants from Uganda (10.2%, a difference of 0.040%), Immigrants from Kazakhstan (10.2%, a difference of 0.050%), Immigrants from England (10.3%, a difference of 0.12%), Spaniard (10.3%, a difference of 0.13%), and Lithuanian (10.2%, a difference of 0.14%).
| Demographics | Rating | Rank | Unemployment Among Ages 20 to 24 years |
| Immigrants | Scotland | 74.6 /100 | #149 | Good 10.2% |
| Hungarians | 74.4 /100 | #150 | Good 10.2% |
| Immigrants | South Africa | 73.6 /100 | #151 | Good 10.2% |
| Iranians | 72.4 /100 | #152 | Good 10.2% |
| Immigrants | Taiwan | 71.4 /100 | #153 | Good 10.2% |
| Immigrants | Switzerland | 71.3 /100 | #154 | Good 10.2% |
| Lithuanians | 70.0 /100 | #155 | Good 10.2% |
| Canadians | 66.7 /100 | #156 | Good 10.2% |
| Immigrants | Uganda | 65.6 /100 | #157 | Good 10.2% |
| Immigrants | Kazakhstan | 65.5 /100 | #158 | Good 10.2% |
| Immigrants | England | 63.7 /100 | #159 | Good 10.3% |
| Spaniards | 63.4 /100 | #160 | Good 10.3% |
| Indians (Asian) | 62.6 /100 | #161 | Good 10.3% |
| Immigrants | Asia | 61.3 /100 | #162 | Good 10.3% |
| Estonians | 61.1 /100 | #163 | Good 10.3% |
Demographics Similar to Immigrants from Bolivia by Unemployment Among Ages 20 to 24 years
In terms of unemployment among ages 20 to 24 years, the demographic groups most similar to Immigrants from Bolivia are Mongolian (9.9%, a difference of 0.050%), Scottish (9.8%, a difference of 0.11%), Bulgarian (9.9%, a difference of 0.13%), Welsh (9.8%, a difference of 0.19%), and Immigrants from Croatia (9.9%, a difference of 0.25%).
| Demographics | Rating | Rank | Unemployment Among Ages 20 to 24 years |
| Immigrants | Kuwait | 99.5 /100 | #60 | Exceptional 9.8% |
| Malaysians | 99.5 /100 | #61 | Exceptional 9.8% |
| Immigrants | Singapore | 99.4 /100 | #62 | Exceptional 9.8% |
| British | 99.4 /100 | #63 | Exceptional 9.8% |
| Serbians | 99.4 /100 | #64 | Exceptional 9.8% |
| Welsh | 99.3 /100 | #65 | Exceptional 9.8% |
| Scottish | 99.3 /100 | #66 | Exceptional 9.8% |
| Immigrants | Bolivia | 99.2 /100 | #67 | Exceptional 9.9% |
| Mongolians | 99.1 /100 | #68 | Exceptional 9.9% |
| Bulgarians | 99.1 /100 | #69 | Exceptional 9.9% |
| Immigrants | Croatia | 99.0 /100 | #70 | Exceptional 9.9% |
| Celtics | 98.9 /100 | #71 | Exceptional 9.9% |
| Bolivians | 98.9 /100 | #72 | Exceptional 9.9% |
| Kenyans | 98.7 /100 | #73 | Exceptional 9.9% |
| Immigrants | Laos | 98.7 /100 | #74 | Exceptional 9.9% |