Cambodian vs Austrian Single Mother Poverty
COMPARE
Cambodian
Austrian
Single Mother Poverty
Single Mother Poverty Comparison
Cambodians
Austrians
27.0%
SINGLE MOTHER POVERTY
99.8/ 100
METRIC RATING
49th/ 347
METRIC RANK
28.7%
SINGLE MOTHER POVERTY
79.0/ 100
METRIC RATING
152nd/ 347
METRIC RANK
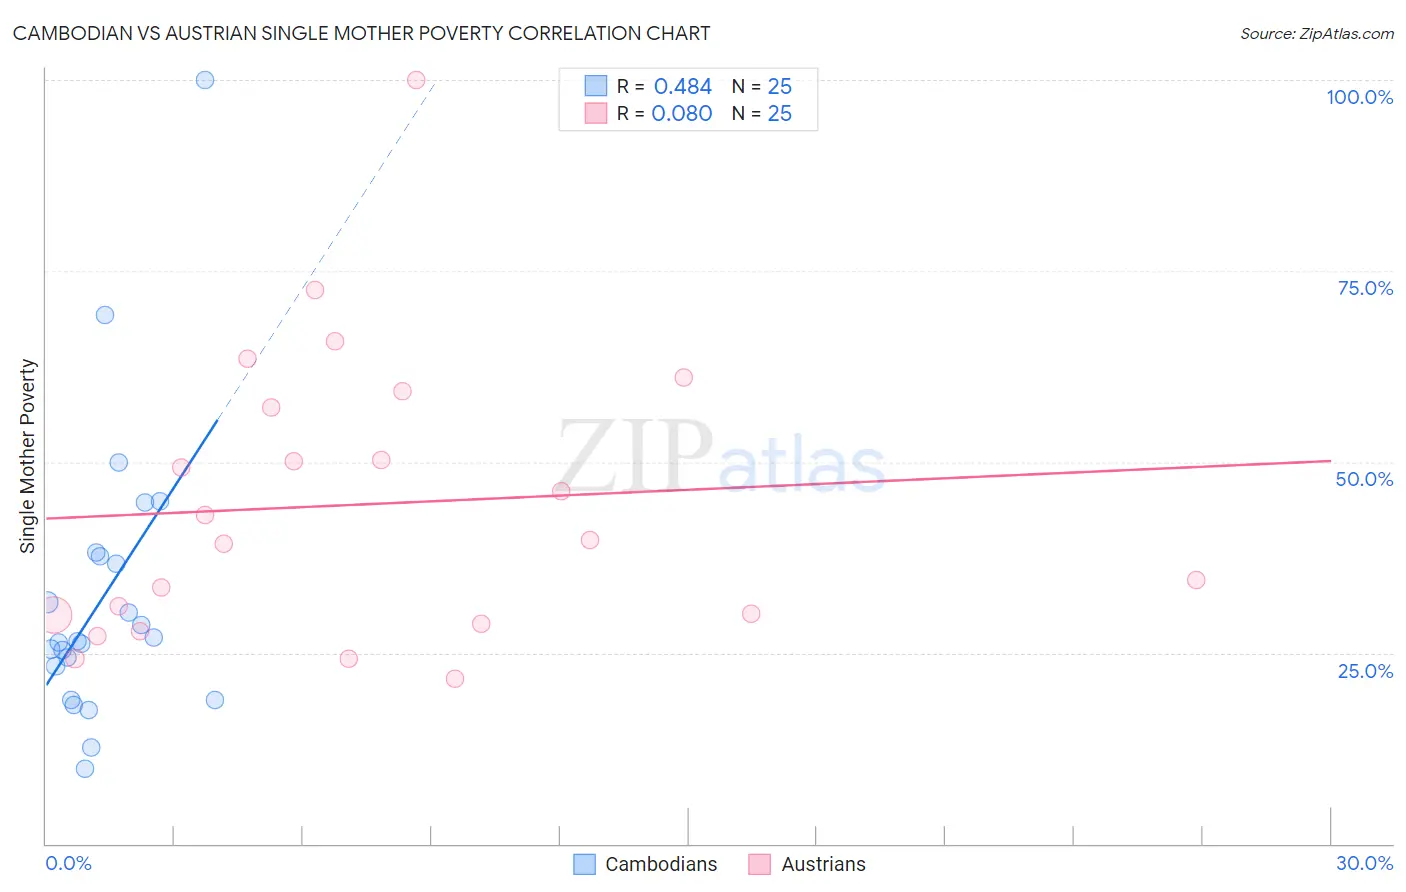
Cambodian vs Austrian Single Mother Poverty Correlation Chart
The statistical analysis conducted on geographies consisting of 101,772,823 people shows a moderate positive correlation between the proportion of Cambodians and poverty level among single mothers in the United States with a correlation coefficient (R) of 0.484 and weighted average of 27.0%. Similarly, the statistical analysis conducted on geographies consisting of 435,772,358 people shows a slight positive correlation between the proportion of Austrians and poverty level among single mothers in the United States with a correlation coefficient (R) of 0.080 and weighted average of 28.7%, a difference of 6.5%.
Single Mother Poverty Correlation Summary
| Measurement | Cambodian | Austrian |
| Minimum | 9.8% | 21.6% |
| Maximum | 100.0% | 100.0% |
| Range | 90.2% | 78.4% |
| Mean | 32.5% | 44.4% |
| Median | 26.5% | 39.8% |
| Interquartile 25% (IQ1) | 21.0% | 29.3% |
| Interquartile 75% (IQ3) | 37.8% | 58.2% |
| Interquartile Range (IQR) | 16.8% | 28.8% |
| Standard Deviation (Sample) | 19.1% | 18.8% |
| Standard Deviation (Population) | 18.7% | 18.4% |
Similar Demographics by Single Mother Poverty
Demographics Similar to Cambodians by Single Mother Poverty
In terms of single mother poverty, the demographic groups most similar to Cambodians are Laotian (27.0%, a difference of 0.010%), Immigrants from Poland (26.9%, a difference of 0.080%), Egyptian (26.9%, a difference of 0.16%), Immigrants from Serbia (26.9%, a difference of 0.22%), and Latvian (26.9%, a difference of 0.26%).
| Demographics | Rating | Rank | Single Mother Poverty |
| Armenians | 99.9 /100 | #42 | Exceptional 26.8% |
| Tsimshian | 99.9 /100 | #43 | Exceptional 26.8% |
| Immigrants | Sierra Leone | 99.9 /100 | #44 | Exceptional 26.9% |
| Latvians | 99.9 /100 | #45 | Exceptional 26.9% |
| Immigrants | Serbia | 99.9 /100 | #46 | Exceptional 26.9% |
| Egyptians | 99.8 /100 | #47 | Exceptional 26.9% |
| Immigrants | Poland | 99.8 /100 | #48 | Exceptional 26.9% |
| Cambodians | 99.8 /100 | #49 | Exceptional 27.0% |
| Laotians | 99.8 /100 | #50 | Exceptional 27.0% |
| Immigrants | Argentina | 99.7 /100 | #51 | Exceptional 27.1% |
| Immigrants | South Eastern Asia | 99.7 /100 | #52 | Exceptional 27.1% |
| Immigrants | Jordan | 99.7 /100 | #53 | Exceptional 27.1% |
| Immigrants | Bulgaria | 99.7 /100 | #54 | Exceptional 27.1% |
| Immigrants | Egypt | 99.7 /100 | #55 | Exceptional 27.1% |
| Immigrants | Romania | 99.7 /100 | #56 | Exceptional 27.2% |
Demographics Similar to Austrians by Single Mother Poverty
In terms of single mother poverty, the demographic groups most similar to Austrians are Immigrants from Oceania (28.7%, a difference of 0.070%), Slovene (28.8%, a difference of 0.18%), Northern European (28.6%, a difference of 0.21%), Portuguese (28.8%, a difference of 0.39%), and Ugandan (28.8%, a difference of 0.47%).
| Demographics | Rating | Rank | Single Mother Poverty |
| Immigrants | South America | 86.1 /100 | #145 | Excellent 28.5% |
| Immigrants | Denmark | 86.1 /100 | #146 | Excellent 28.5% |
| Immigrants | Lebanon | 85.3 /100 | #147 | Excellent 28.6% |
| Syrians | 85.3 /100 | #148 | Excellent 28.6% |
| Serbians | 85.0 /100 | #149 | Excellent 28.6% |
| Northern Europeans | 81.7 /100 | #150 | Excellent 28.6% |
| Immigrants | Oceania | 79.9 /100 | #151 | Good 28.7% |
| Austrians | 79.0 /100 | #152 | Good 28.7% |
| Slovenes | 76.4 /100 | #153 | Good 28.8% |
| Portuguese | 73.2 /100 | #154 | Good 28.8% |
| Ugandans | 71.7 /100 | #155 | Good 28.8% |
| Iraqis | 71.5 /100 | #156 | Good 28.8% |
| Immigrants | Western Europe | 71.1 /100 | #157 | Good 28.9% |
| Immigrants | Hungary | 70.6 /100 | #158 | Good 28.9% |
| Czechs | 68.4 /100 | #159 | Good 28.9% |