Cambodian vs Immigrants from Pakistan Single Mother Poverty
COMPARE
Cambodian
Immigrants from Pakistan
Single Mother Poverty
Single Mother Poverty Comparison
Cambodians
Immigrants from Pakistan
27.0%
SINGLE MOTHER POVERTY
99.8/ 100
METRIC RATING
49th/ 347
METRIC RANK
26.0%
SINGLE MOTHER POVERTY
100.0/ 100
METRIC RATING
18th/ 347
METRIC RANK
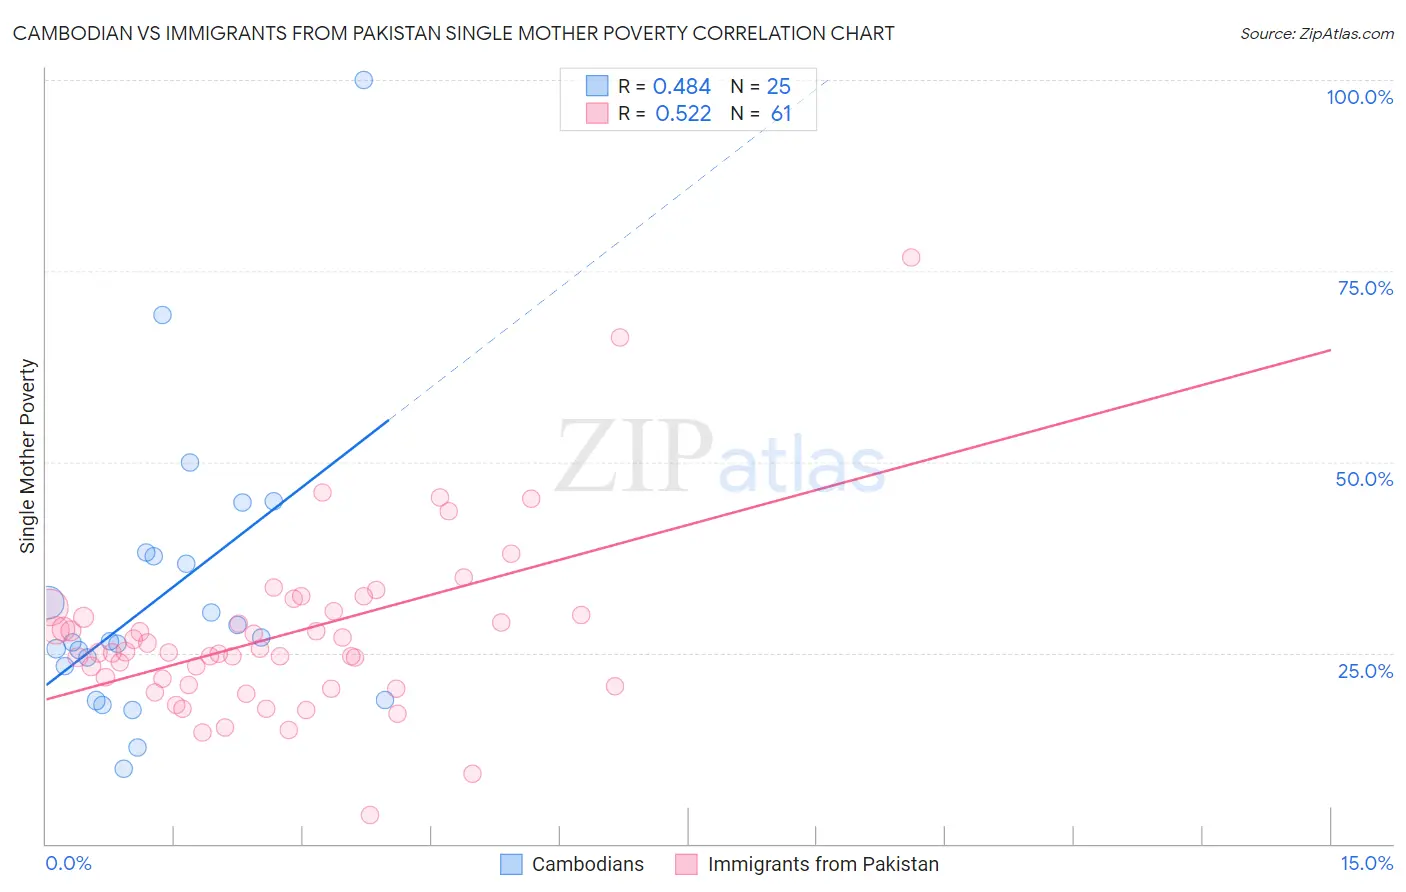
Cambodian vs Immigrants from Pakistan Single Mother Poverty Correlation Chart
The statistical analysis conducted on geographies consisting of 101,772,823 people shows a moderate positive correlation between the proportion of Cambodians and poverty level among single mothers in the United States with a correlation coefficient (R) of 0.484 and weighted average of 27.0%. Similarly, the statistical analysis conducted on geographies consisting of 278,589,508 people shows a substantial positive correlation between the proportion of Immigrants from Pakistan and poverty level among single mothers in the United States with a correlation coefficient (R) of 0.522 and weighted average of 26.0%, a difference of 3.5%.
Single Mother Poverty Correlation Summary
| Measurement | Cambodian | Immigrants from Pakistan |
| Minimum | 9.8% | 3.7% |
| Maximum | 100.0% | 76.8% |
| Range | 90.2% | 73.0% |
| Mean | 32.5% | 27.3% |
| Median | 26.5% | 25.0% |
| Interquartile 25% (IQ1) | 21.0% | 20.7% |
| Interquartile 75% (IQ3) | 37.8% | 30.2% |
| Interquartile Range (IQR) | 16.8% | 9.5% |
| Standard Deviation (Sample) | 19.1% | 11.5% |
| Standard Deviation (Population) | 18.7% | 11.4% |
Similar Demographics by Single Mother Poverty
Demographics Similar to Cambodians by Single Mother Poverty
In terms of single mother poverty, the demographic groups most similar to Cambodians are Laotian (27.0%, a difference of 0.010%), Immigrants from Poland (26.9%, a difference of 0.080%), Egyptian (26.9%, a difference of 0.16%), Immigrants from Serbia (26.9%, a difference of 0.22%), and Latvian (26.9%, a difference of 0.26%).
| Demographics | Rating | Rank | Single Mother Poverty |
| Armenians | 99.9 /100 | #42 | Exceptional 26.8% |
| Tsimshian | 99.9 /100 | #43 | Exceptional 26.8% |
| Immigrants | Sierra Leone | 99.9 /100 | #44 | Exceptional 26.9% |
| Latvians | 99.9 /100 | #45 | Exceptional 26.9% |
| Immigrants | Serbia | 99.9 /100 | #46 | Exceptional 26.9% |
| Egyptians | 99.8 /100 | #47 | Exceptional 26.9% |
| Immigrants | Poland | 99.8 /100 | #48 | Exceptional 26.9% |
| Cambodians | 99.8 /100 | #49 | Exceptional 27.0% |
| Laotians | 99.8 /100 | #50 | Exceptional 27.0% |
| Immigrants | Argentina | 99.7 /100 | #51 | Exceptional 27.1% |
| Immigrants | South Eastern Asia | 99.7 /100 | #52 | Exceptional 27.1% |
| Immigrants | Jordan | 99.7 /100 | #53 | Exceptional 27.1% |
| Immigrants | Bulgaria | 99.7 /100 | #54 | Exceptional 27.1% |
| Immigrants | Egypt | 99.7 /100 | #55 | Exceptional 27.1% |
| Immigrants | Romania | 99.7 /100 | #56 | Exceptional 27.2% |
Demographics Similar to Immigrants from Pakistan by Single Mother Poverty
In terms of single mother poverty, the demographic groups most similar to Immigrants from Pakistan are Immigrants from Eastern Asia (26.1%, a difference of 0.14%), Immigrants from China (26.1%, a difference of 0.27%), Asian (26.0%, a difference of 0.28%), Bolivian (25.9%, a difference of 0.46%), and Immigrants from Bolivia (26.2%, a difference of 0.46%).
| Demographics | Rating | Rank | Single Mother Poverty |
| Iranians | 100.0 /100 | #11 | Exceptional 25.5% |
| Bhutanese | 100.0 /100 | #12 | Exceptional 25.6% |
| Indians (Asian) | 100.0 /100 | #13 | Exceptional 25.8% |
| Immigrants | Singapore | 100.0 /100 | #14 | Exceptional 25.8% |
| Immigrants | Ireland | 100.0 /100 | #15 | Exceptional 25.8% |
| Bolivians | 100.0 /100 | #16 | Exceptional 25.9% |
| Asians | 100.0 /100 | #17 | Exceptional 26.0% |
| Immigrants | Pakistan | 100.0 /100 | #18 | Exceptional 26.0% |
| Immigrants | Eastern Asia | 100.0 /100 | #19 | Exceptional 26.1% |
| Immigrants | China | 100.0 /100 | #20 | Exceptional 26.1% |
| Immigrants | Bolivia | 100.0 /100 | #21 | Exceptional 26.2% |
| Immigrants | Korea | 100.0 /100 | #22 | Exceptional 26.2% |
| Burmese | 100.0 /100 | #23 | Exceptional 26.2% |
| Immigrants | Moldova | 100.0 /100 | #24 | Exceptional 26.2% |
| Immigrants | Asia | 100.0 /100 | #25 | Exceptional 26.3% |