Cajun vs Serbian Single Male Poverty
COMPARE
Cajun
Serbian
Single Male Poverty
Single Male Poverty Comparison
Cajuns
Serbians
19.1%
SINGLE MALE POVERTY
0.0/ 100
METRIC RATING
330th/ 347
METRIC RANK
12.5%
SINGLE MALE POVERTY
87.9/ 100
METRIC RATING
122nd/ 347
METRIC RANK
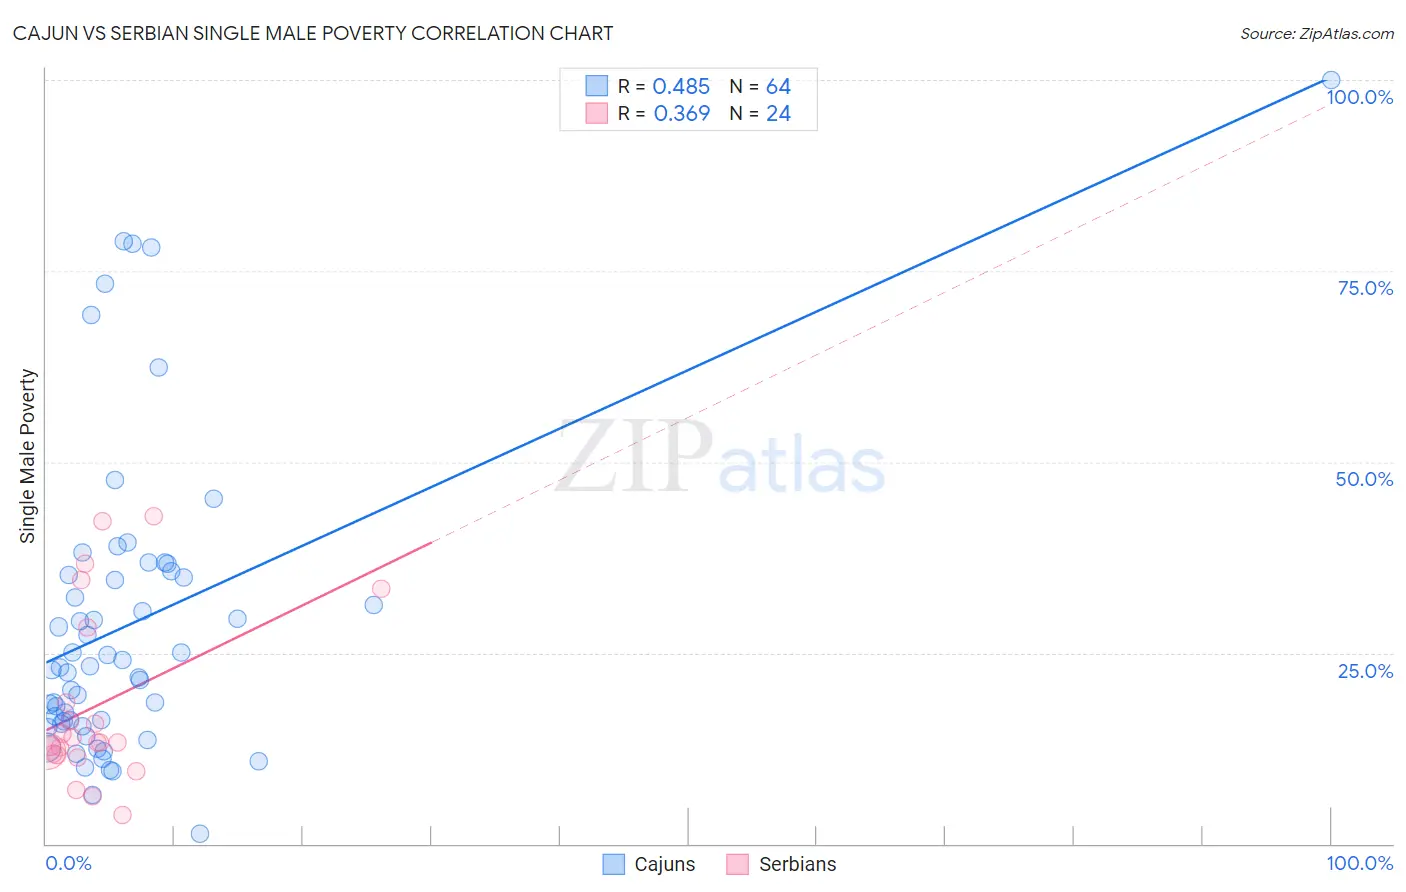
Cajun vs Serbian Single Male Poverty Correlation Chart
The statistical analysis conducted on geographies consisting of 139,673,015 people shows a moderate positive correlation between the proportion of Cajuns and poverty level among single males in the United States with a correlation coefficient (R) of 0.485 and weighted average of 19.1%. Similarly, the statistical analysis conducted on geographies consisting of 240,171,110 people shows a mild positive correlation between the proportion of Serbians and poverty level among single males in the United States with a correlation coefficient (R) of 0.369 and weighted average of 12.5%, a difference of 53.0%.
Single Male Poverty Correlation Summary
| Measurement | Cajun | Serbian |
| Minimum | 1.3% | 3.8% |
| Maximum | 100.0% | 42.9% |
| Range | 98.7% | 39.0% |
| Mean | 28.9% | 18.1% |
| Median | 23.1% | 13.3% |
| Interquartile 25% (IQ1) | 15.9% | 11.7% |
| Interquartile 75% (IQ3) | 35.5% | 23.5% |
| Interquartile Range (IQR) | 19.6% | 11.7% |
| Standard Deviation (Sample) | 20.0% | 11.5% |
| Standard Deviation (Population) | 19.9% | 11.2% |
Similar Demographics by Single Male Poverty
Demographics Similar to Cajuns by Single Male Poverty
In terms of single male poverty, the demographic groups most similar to Cajuns are Paiute (19.3%, a difference of 1.1%), Native/Alaskan (19.6%, a difference of 2.8%), Colville (18.4%, a difference of 3.5%), Kiowa (18.3%, a difference of 4.2%), and Inupiat (20.0%, a difference of 4.8%).
| Demographics | Rating | Rank | Single Male Poverty |
| Creek | 0.0 /100 | #323 | Tragic 16.8% |
| Immigrants | Yemen | 0.0 /100 | #324 | Tragic 16.9% |
| Choctaw | 0.0 /100 | #325 | Tragic 17.0% |
| Central American Indians | 0.0 /100 | #326 | Tragic 17.2% |
| Menominee | 0.0 /100 | #327 | Tragic 17.7% |
| Kiowa | 0.0 /100 | #328 | Tragic 18.3% |
| Colville | 0.0 /100 | #329 | Tragic 18.4% |
| Cajuns | 0.0 /100 | #330 | Tragic 19.1% |
| Paiute | 0.0 /100 | #331 | Tragic 19.3% |
| Natives/Alaskans | 0.0 /100 | #332 | Tragic 19.6% |
| Inupiat | 0.0 /100 | #333 | Tragic 20.0% |
| Pima | 0.0 /100 | #334 | Tragic 20.2% |
| Yuman | 0.0 /100 | #335 | Tragic 21.3% |
| Tohono O'odham | 0.0 /100 | #336 | Tragic 21.6% |
| Apache | 0.0 /100 | #337 | Tragic 21.6% |
Demographics Similar to Serbians by Single Male Poverty
In terms of single male poverty, the demographic groups most similar to Serbians are Immigrants from Kenya (12.5%, a difference of 0.040%), Icelander (12.5%, a difference of 0.050%), Russian (12.5%, a difference of 0.070%), Immigrants from Jordan (12.5%, a difference of 0.10%), and Romanian (12.5%, a difference of 0.18%).
| Demographics | Rating | Rank | Single Male Poverty |
| Immigrants | Southern Europe | 91.5 /100 | #115 | Exceptional 12.4% |
| Immigrants | Syria | 91.2 /100 | #116 | Exceptional 12.4% |
| Immigrants | Oceania | 91.1 /100 | #117 | Exceptional 12.4% |
| Albanians | 90.6 /100 | #118 | Exceptional 12.4% |
| Immigrants | Albania | 90.3 /100 | #119 | Exceptional 12.4% |
| Venezuelans | 89.4 /100 | #120 | Excellent 12.4% |
| Icelanders | 88.2 /100 | #121 | Excellent 12.5% |
| Serbians | 87.9 /100 | #122 | Excellent 12.5% |
| Immigrants | Kenya | 87.6 /100 | #123 | Excellent 12.5% |
| Russians | 87.3 /100 | #124 | Excellent 12.5% |
| Immigrants | Jordan | 87.1 /100 | #125 | Excellent 12.5% |
| Romanians | 86.4 /100 | #126 | Excellent 12.5% |
| Immigrants | Netherlands | 86.2 /100 | #127 | Excellent 12.5% |
| Ecuadorians | 85.9 /100 | #128 | Excellent 12.5% |
| Immigrants | Sierra Leone | 85.5 /100 | #129 | Excellent 12.5% |