Cajun vs Macedonian Single Male Poverty
COMPARE
Cajun
Macedonian
Single Male Poverty
Single Male Poverty Comparison
Cajuns
Macedonians
19.1%
SINGLE MALE POVERTY
0.0/ 100
METRIC RATING
330th/ 347
METRIC RANK
12.9%
SINGLE MALE POVERTY
31.5/ 100
METRIC RATING
188th/ 347
METRIC RANK
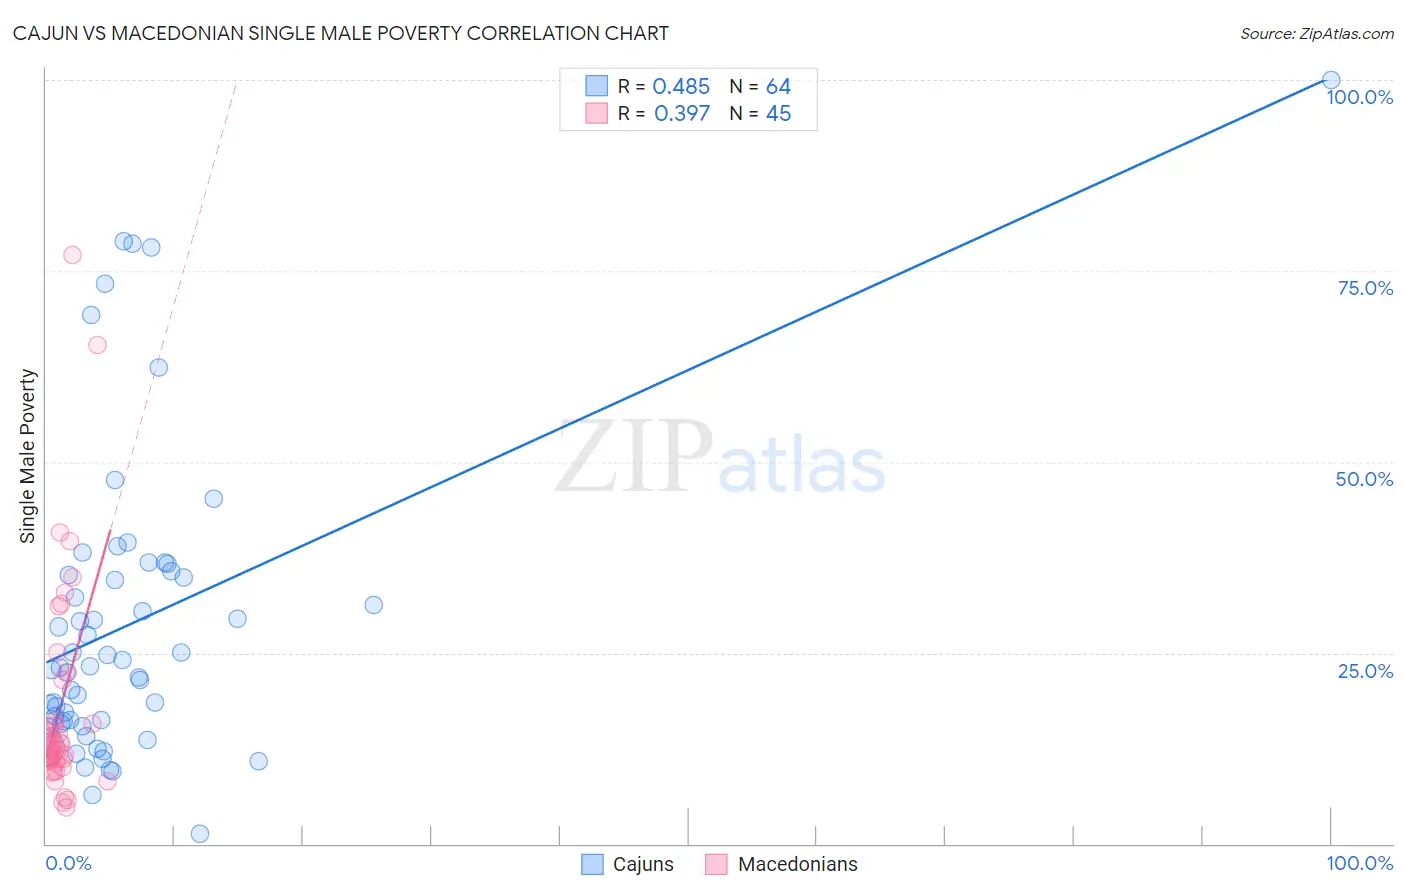
Cajun vs Macedonian Single Male Poverty Correlation Chart
The statistical analysis conducted on geographies consisting of 139,673,015 people shows a moderate positive correlation between the proportion of Cajuns and poverty level among single males in the United States with a correlation coefficient (R) of 0.485 and weighted average of 19.1%. Similarly, the statistical analysis conducted on geographies consisting of 122,668,243 people shows a mild positive correlation between the proportion of Macedonians and poverty level among single males in the United States with a correlation coefficient (R) of 0.397 and weighted average of 12.9%, a difference of 47.5%.
Single Male Poverty Correlation Summary
| Measurement | Cajun | Macedonian |
| Minimum | 1.3% | 4.8% |
| Maximum | 100.0% | 77.1% |
| Range | 98.7% | 72.3% |
| Mean | 28.9% | 17.9% |
| Median | 23.1% | 12.4% |
| Interquartile 25% (IQ1) | 15.9% | 10.7% |
| Interquartile 75% (IQ3) | 35.5% | 18.7% |
| Interquartile Range (IQR) | 19.6% | 8.1% |
| Standard Deviation (Sample) | 20.0% | 14.7% |
| Standard Deviation (Population) | 19.9% | 14.5% |
Similar Demographics by Single Male Poverty
Demographics Similar to Cajuns by Single Male Poverty
In terms of single male poverty, the demographic groups most similar to Cajuns are Paiute (19.3%, a difference of 1.1%), Native/Alaskan (19.6%, a difference of 2.8%), Colville (18.4%, a difference of 3.5%), Kiowa (18.3%, a difference of 4.2%), and Inupiat (20.0%, a difference of 4.8%).
| Demographics | Rating | Rank | Single Male Poverty |
| Creek | 0.0 /100 | #323 | Tragic 16.8% |
| Immigrants | Yemen | 0.0 /100 | #324 | Tragic 16.9% |
| Choctaw | 0.0 /100 | #325 | Tragic 17.0% |
| Central American Indians | 0.0 /100 | #326 | Tragic 17.2% |
| Menominee | 0.0 /100 | #327 | Tragic 17.7% |
| Kiowa | 0.0 /100 | #328 | Tragic 18.3% |
| Colville | 0.0 /100 | #329 | Tragic 18.4% |
| Cajuns | 0.0 /100 | #330 | Tragic 19.1% |
| Paiute | 0.0 /100 | #331 | Tragic 19.3% |
| Natives/Alaskans | 0.0 /100 | #332 | Tragic 19.6% |
| Inupiat | 0.0 /100 | #333 | Tragic 20.0% |
| Pima | 0.0 /100 | #334 | Tragic 20.2% |
| Yuman | 0.0 /100 | #335 | Tragic 21.3% |
| Tohono O'odham | 0.0 /100 | #336 | Tragic 21.6% |
| Apache | 0.0 /100 | #337 | Tragic 21.6% |
Demographics Similar to Macedonians by Single Male Poverty
In terms of single male poverty, the demographic groups most similar to Macedonians are Immigrants from Kuwait (12.9%, a difference of 0.020%), Norwegian (12.9%, a difference of 0.030%), Nigerian (12.9%, a difference of 0.030%), Immigrants from Trinidad and Tobago (12.9%, a difference of 0.060%), and Portuguese (12.9%, a difference of 0.080%).
| Demographics | Rating | Rank | Single Male Poverty |
| Panamanians | 37.6 /100 | #181 | Fair 12.9% |
| Moroccans | 36.8 /100 | #182 | Fair 12.9% |
| Immigrants | West Indies | 33.0 /100 | #183 | Fair 12.9% |
| Immigrants | Trinidad and Tobago | 32.5 /100 | #184 | Fair 12.9% |
| Norwegians | 32.0 /100 | #185 | Fair 12.9% |
| Nigerians | 31.9 /100 | #186 | Fair 12.9% |
| Immigrants | Kuwait | 31.9 /100 | #187 | Fair 12.9% |
| Macedonians | 31.5 /100 | #188 | Fair 12.9% |
| Portuguese | 30.2 /100 | #189 | Fair 12.9% |
| Arabs | 27.0 /100 | #190 | Fair 13.0% |
| Immigrants | Thailand | 26.6 /100 | #191 | Fair 13.0% |
| Immigrants | Jamaica | 26.5 /100 | #192 | Fair 13.0% |
| Immigrants | South Africa | 26.1 /100 | #193 | Fair 13.0% |
| Liberians | 25.2 /100 | #194 | Fair 13.0% |
| Immigrants | England | 23.4 /100 | #195 | Fair 13.0% |