Cajun vs Serbian Associate's Degree
COMPARE
Cajun
Serbian
Associate's Degree
Associate's Degree Comparison
Cajuns
Serbians
37.4%
ASSOCIATE'S DEGREE
0.0/ 100
METRIC RATING
320th/ 347
METRIC RANK
48.5%
ASSOCIATE'S DEGREE
92.6/ 100
METRIC RATING
124th/ 347
METRIC RANK
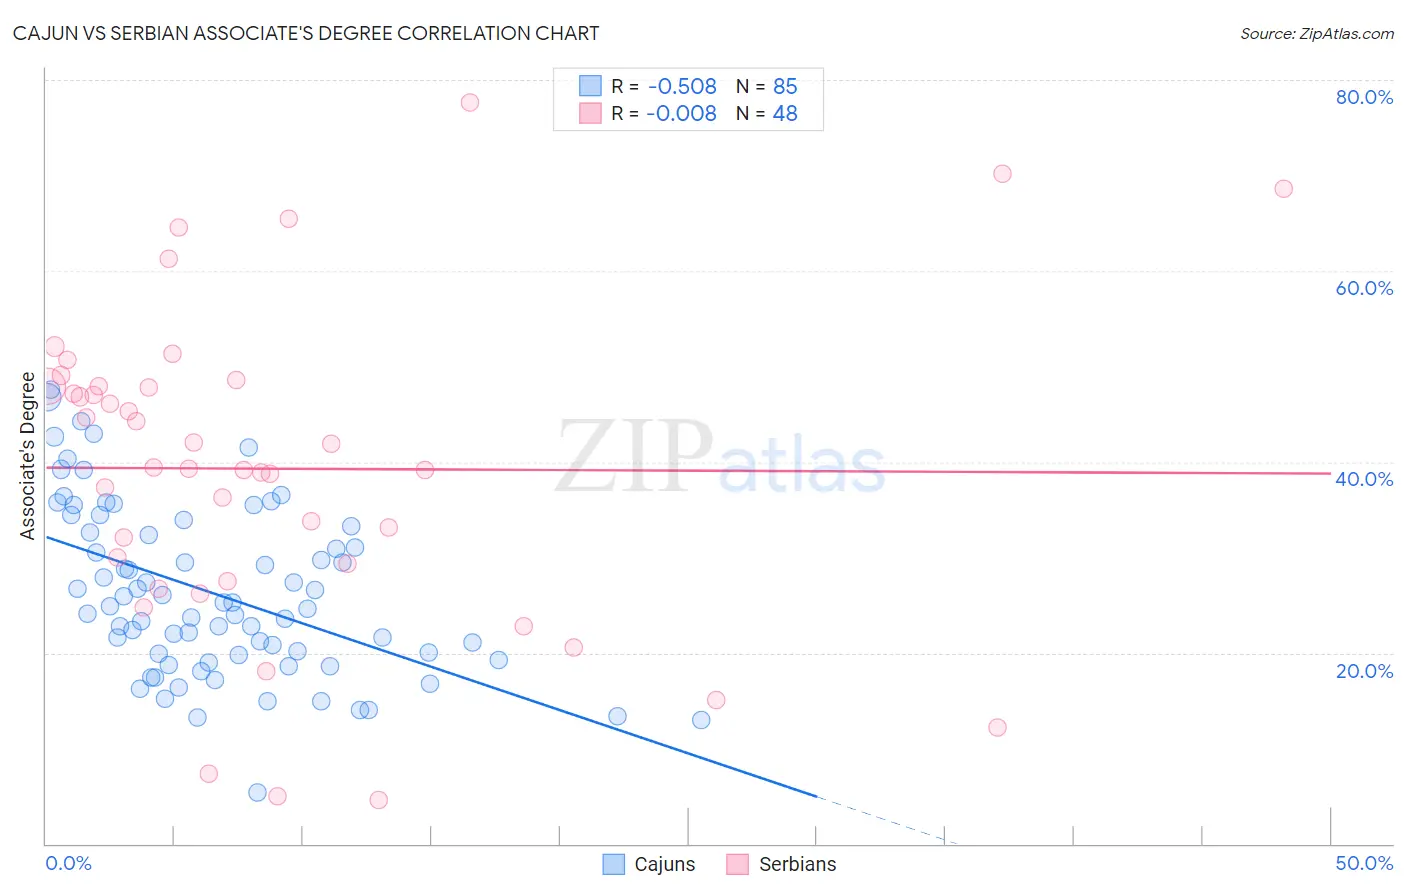
Cajun vs Serbian Associate's Degree Correlation Chart
The statistical analysis conducted on geographies consisting of 149,710,978 people shows a substantial negative correlation between the proportion of Cajuns and percentage of population with at least associate's degree education in the United States with a correlation coefficient (R) of -0.508 and weighted average of 37.4%. Similarly, the statistical analysis conducted on geographies consisting of 267,638,366 people shows no correlation between the proportion of Serbians and percentage of population with at least associate's degree education in the United States with a correlation coefficient (R) of -0.008 and weighted average of 48.5%, a difference of 29.9%.
Associate's Degree Correlation Summary
| Measurement | Cajun | Serbian |
| Minimum | 5.4% | 4.6% |
| Maximum | 47.6% | 77.6% |
| Range | 42.2% | 73.0% |
| Mean | 26.2% | 39.3% |
| Median | 24.9% | 39.3% |
| Interquartile 25% (IQ1) | 19.5% | 28.5% |
| Interquartile 75% (IQ3) | 32.9% | 47.9% |
| Interquartile Range (IQR) | 13.4% | 19.5% |
| Standard Deviation (Sample) | 8.9% | 16.7% |
| Standard Deviation (Population) | 8.8% | 16.5% |
Similar Demographics by Associate's Degree
Demographics Similar to Cajuns by Associate's Degree
In terms of associate's degree, the demographic groups most similar to Cajuns are Fijian (37.4%, a difference of 0.030%), Immigrants from Yemen (37.3%, a difference of 0.12%), Alaska Native (37.5%, a difference of 0.25%), Pennsylvania German (37.2%, a difference of 0.40%), and Yaqui (37.6%, a difference of 0.48%).
| Demographics | Rating | Rank | Associate's Degree |
| Hispanics or Latinos | 0.0 /100 | #313 | Tragic 37.7% |
| Seminole | 0.0 /100 | #314 | Tragic 37.7% |
| Creek | 0.0 /100 | #315 | Tragic 37.6% |
| Crow | 0.0 /100 | #316 | Tragic 37.6% |
| Yaqui | 0.0 /100 | #317 | Tragic 37.6% |
| Alaska Natives | 0.0 /100 | #318 | Tragic 37.5% |
| Fijians | 0.0 /100 | #319 | Tragic 37.4% |
| Cajuns | 0.0 /100 | #320 | Tragic 37.4% |
| Immigrants | Yemen | 0.0 /100 | #321 | Tragic 37.3% |
| Pennsylvania Germans | 0.0 /100 | #322 | Tragic 37.2% |
| Immigrants | Cabo Verde | 0.0 /100 | #323 | Tragic 36.8% |
| Arapaho | 0.0 /100 | #324 | Tragic 36.7% |
| Menominee | 0.0 /100 | #325 | Tragic 36.7% |
| Kiowa | 0.0 /100 | #326 | Tragic 36.5% |
| Dutch West Indians | 0.0 /100 | #327 | Tragic 36.5% |
Demographics Similar to Serbians by Associate's Degree
In terms of associate's degree, the demographic groups most similar to Serbians are Chinese (48.5%, a difference of 0.020%), Immigrants from Syria (48.5%, a difference of 0.10%), Immigrants from Uganda (48.5%, a difference of 0.12%), Immigrants from Eastern Africa (48.4%, a difference of 0.23%), and Swedish (48.4%, a difference of 0.27%).
| Demographics | Rating | Rank | Associate's Degree |
| Afghans | 94.8 /100 | #117 | Exceptional 48.9% |
| Albanians | 94.7 /100 | #118 | Exceptional 48.8% |
| Lebanese | 94.6 /100 | #119 | Exceptional 48.8% |
| Alsatians | 94.6 /100 | #120 | Exceptional 48.8% |
| Ugandans | 93.9 /100 | #121 | Exceptional 48.7% |
| Italians | 93.9 /100 | #122 | Exceptional 48.7% |
| Brazilians | 93.7 /100 | #123 | Exceptional 48.7% |
| Serbians | 92.6 /100 | #124 | Exceptional 48.5% |
| Chinese | 92.5 /100 | #125 | Exceptional 48.5% |
| Immigrants | Syria | 92.2 /100 | #126 | Exceptional 48.5% |
| Immigrants | Uganda | 92.1 /100 | #127 | Exceptional 48.5% |
| Immigrants | Eastern Africa | 91.6 /100 | #128 | Exceptional 48.4% |
| Swedes | 91.5 /100 | #129 | Exceptional 48.4% |
| Immigrants | Jordan | 91.2 /100 | #130 | Exceptional 48.4% |
| Icelanders | 90.8 /100 | #131 | Exceptional 48.3% |