Cajun vs West Indian Family Poverty
COMPARE
Cajun
West Indian
Family Poverty
Family Poverty Comparison
Cajuns
West Indians
11.9%
FAMILY POVERTY
0.0/ 100
METRIC RATING
306th/ 347
METRIC RANK
11.5%
FAMILY POVERTY
0.0/ 100
METRIC RATING
290th/ 347
METRIC RANK
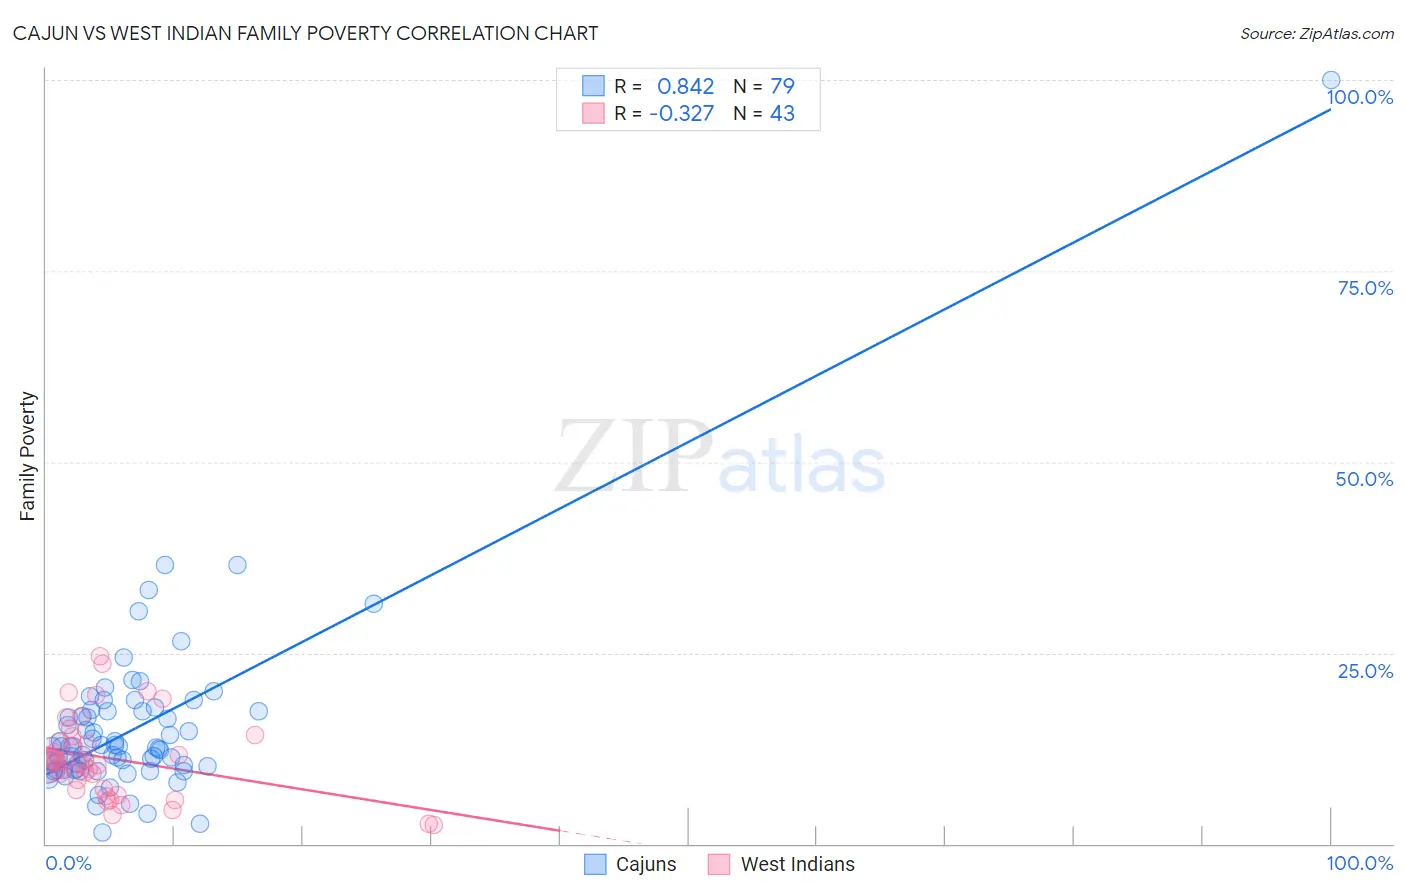
Cajun vs West Indian Family Poverty Correlation Chart
The statistical analysis conducted on geographies consisting of 149,591,536 people shows a very strong positive correlation between the proportion of Cajuns and poverty level among families in the United States with a correlation coefficient (R) of 0.842 and weighted average of 11.9%. Similarly, the statistical analysis conducted on geographies consisting of 253,611,735 people shows a mild negative correlation between the proportion of West Indians and poverty level among families in the United States with a correlation coefficient (R) of -0.327 and weighted average of 11.5%, a difference of 3.1%.
Family Poverty Correlation Summary
| Measurement | Cajun | West Indian |
| Minimum | 1.5% | 2.5% |
| Maximum | 100.0% | 24.5% |
| Range | 98.5% | 22.0% |
| Mean | 15.2% | 11.2% |
| Median | 12.7% | 10.5% |
| Interquartile 25% (IQ1) | 9.9% | 7.1% |
| Interquartile 75% (IQ3) | 17.4% | 14.0% |
| Interquartile Range (IQR) | 7.5% | 6.9% |
| Standard Deviation (Sample) | 11.9% | 5.3% |
| Standard Deviation (Population) | 11.8% | 5.3% |
Demographics Similar to Cajuns and West Indians by Family Poverty
In terms of family poverty, the demographic groups most similar to Cajuns are Immigrants from Congo (11.9%, a difference of 0.11%), Seminole (11.9%, a difference of 0.17%), Mexican (11.8%, a difference of 0.56%), Immigrants from Latin America (11.8%, a difference of 0.74%), and African (11.8%, a difference of 0.93%). Similarly, the demographic groups most similar to West Indians are Immigrants from Barbados (11.5%, a difference of 0.010%), Immigrants from Belize (11.5%, a difference of 0.060%), Haitian (11.5%, a difference of 0.060%), Immigrants from Somalia (11.5%, a difference of 0.17%), and Immigrants from Cabo Verde (11.6%, a difference of 0.60%).
| Demographics | Rating | Rank | Family Poverty |
| Immigrants | Belize | 0.0 /100 | #288 | Tragic 11.5% |
| Immigrants | Barbados | 0.0 /100 | #289 | Tragic 11.5% |
| West Indians | 0.0 /100 | #290 | Tragic 11.5% |
| Haitians | 0.0 /100 | #291 | Tragic 11.5% |
| Immigrants | Somalia | 0.0 /100 | #292 | Tragic 11.5% |
| Immigrants | Cabo Verde | 0.0 /100 | #293 | Tragic 11.6% |
| Immigrants | St. Vincent and the Grenadines | 0.0 /100 | #294 | Tragic 11.6% |
| Immigrants | Haiti | 0.0 /100 | #295 | Tragic 11.6% |
| Choctaw | 0.0 /100 | #296 | Tragic 11.6% |
| Creek | 0.0 /100 | #297 | Tragic 11.7% |
| Immigrants | Senegal | 0.0 /100 | #298 | Tragic 11.7% |
| Dutch West Indians | 0.0 /100 | #299 | Tragic 11.7% |
| Immigrants | Bangladesh | 0.0 /100 | #300 | Tragic 11.7% |
| Bahamians | 0.0 /100 | #301 | Tragic 11.7% |
| Guatemalans | 0.0 /100 | #302 | Tragic 11.7% |
| Africans | 0.0 /100 | #303 | Tragic 11.8% |
| Immigrants | Latin America | 0.0 /100 | #304 | Tragic 11.8% |
| Mexicans | 0.0 /100 | #305 | Tragic 11.8% |
| Cajuns | 0.0 /100 | #306 | Tragic 11.9% |
| Immigrants | Congo | 0.0 /100 | #307 | Tragic 11.9% |
| Seminole | 0.0 /100 | #308 | Tragic 11.9% |