Cajun vs Central American Indian Family Poverty
COMPARE
Cajun
Central American Indian
Family Poverty
Family Poverty Comparison
Cajuns
Central American Indians
11.9%
FAMILY POVERTY
0.0/ 100
METRIC RATING
306th/ 347
METRIC RANK
13.3%
FAMILY POVERTY
0.0/ 100
METRIC RATING
328th/ 347
METRIC RANK
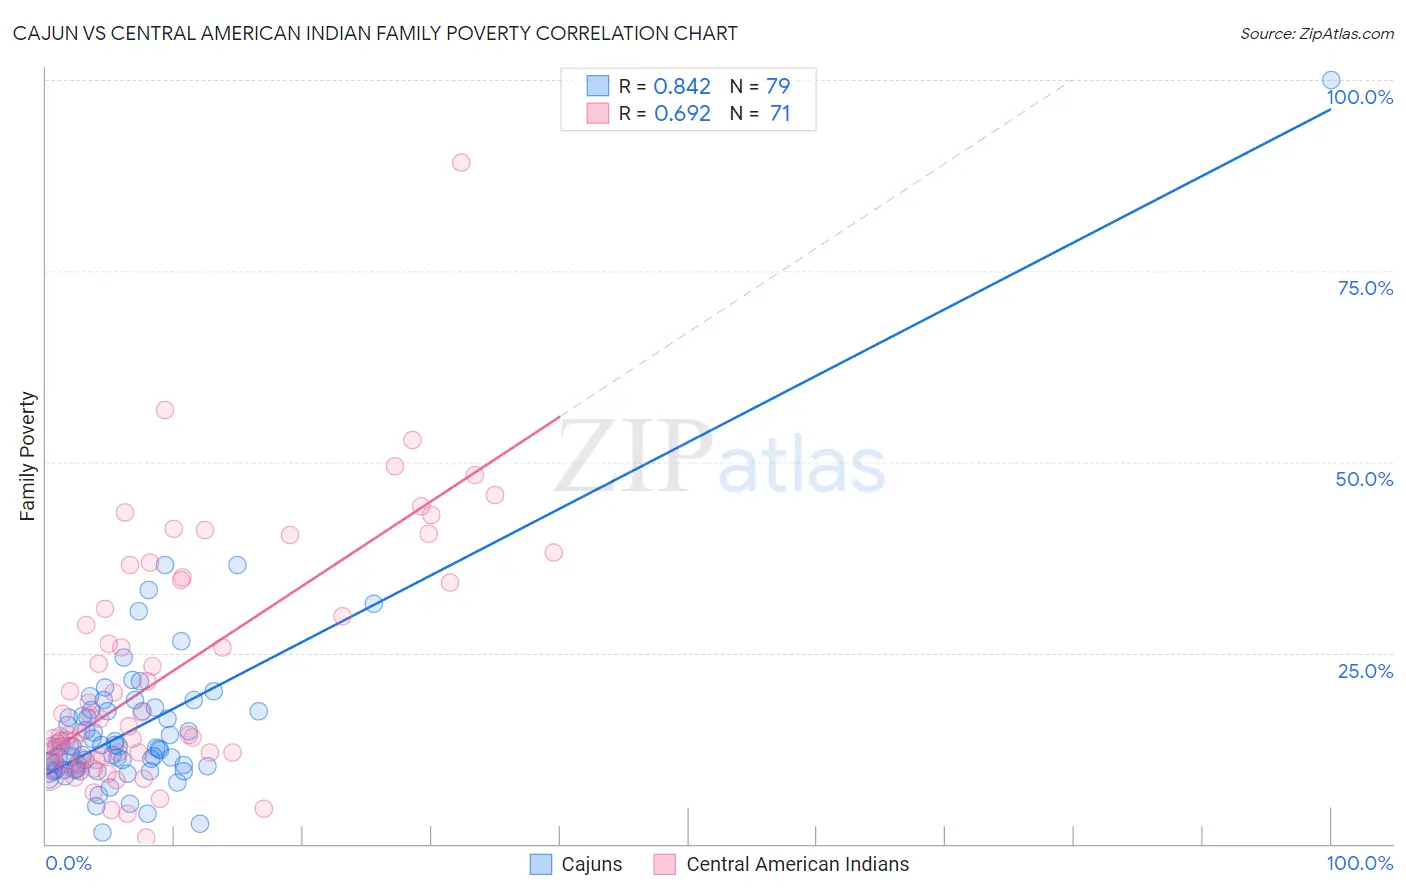
Cajun vs Central American Indian Family Poverty Correlation Chart
The statistical analysis conducted on geographies consisting of 149,591,536 people shows a very strong positive correlation between the proportion of Cajuns and poverty level among families in the United States with a correlation coefficient (R) of 0.842 and weighted average of 11.9%. Similarly, the statistical analysis conducted on geographies consisting of 325,737,058 people shows a significant positive correlation between the proportion of Central American Indians and poverty level among families in the United States with a correlation coefficient (R) of 0.692 and weighted average of 13.3%, a difference of 12.0%.
Family Poverty Correlation Summary
| Measurement | Cajun | Central American Indian |
| Minimum | 1.5% | 0.85% |
| Maximum | 100.0% | 89.1% |
| Range | 98.5% | 88.3% |
| Mean | 15.2% | 22.4% |
| Median | 12.7% | 15.5% |
| Interquartile 25% (IQ1) | 9.9% | 11.1% |
| Interquartile 75% (IQ3) | 17.4% | 34.5% |
| Interquartile Range (IQR) | 7.5% | 23.3% |
| Standard Deviation (Sample) | 11.9% | 16.1% |
| Standard Deviation (Population) | 11.8% | 16.0% |
Similar Demographics by Family Poverty
Demographics Similar to Cajuns by Family Poverty
In terms of family poverty, the demographic groups most similar to Cajuns are Immigrants from Congo (11.9%, a difference of 0.11%), Seminole (11.9%, a difference of 0.17%), Mexican (11.8%, a difference of 0.56%), Hispanic or Latino (12.0%, a difference of 0.61%), and Immigrants from Guatemala (12.0%, a difference of 0.62%).
| Demographics | Rating | Rank | Family Poverty |
| Dutch West Indians | 0.0 /100 | #299 | Tragic 11.7% |
| Immigrants | Bangladesh | 0.0 /100 | #300 | Tragic 11.7% |
| Bahamians | 0.0 /100 | #301 | Tragic 11.7% |
| Guatemalans | 0.0 /100 | #302 | Tragic 11.7% |
| Africans | 0.0 /100 | #303 | Tragic 11.8% |
| Immigrants | Latin America | 0.0 /100 | #304 | Tragic 11.8% |
| Mexicans | 0.0 /100 | #305 | Tragic 11.8% |
| Cajuns | 0.0 /100 | #306 | Tragic 11.9% |
| Immigrants | Congo | 0.0 /100 | #307 | Tragic 11.9% |
| Seminole | 0.0 /100 | #308 | Tragic 11.9% |
| Hispanics or Latinos | 0.0 /100 | #309 | Tragic 12.0% |
| Immigrants | Guatemala | 0.0 /100 | #310 | Tragic 12.0% |
| Ute | 0.0 /100 | #311 | Tragic 12.1% |
| Immigrants | Central America | 0.0 /100 | #312 | Tragic 12.1% |
| Immigrants | Caribbean | 0.0 /100 | #313 | Tragic 12.2% |
Demographics Similar to Central American Indians by Family Poverty
In terms of family poverty, the demographic groups most similar to Central American Indians are Black/African American (13.3%, a difference of 0.17%), Yakama (13.1%, a difference of 1.7%), Colville (13.0%, a difference of 2.4%), Paiute (13.0%, a difference of 2.4%), and Immigrants from Dominica (12.7%, a difference of 4.4%).
| Demographics | Rating | Rank | Family Poverty |
| Arapaho | 0.0 /100 | #321 | Tragic 12.7% |
| Immigrants | Honduras | 0.0 /100 | #322 | Tragic 12.7% |
| Menominee | 0.0 /100 | #323 | Tragic 12.7% |
| Immigrants | Dominica | 0.0 /100 | #324 | Tragic 12.7% |
| Paiute | 0.0 /100 | #325 | Tragic 13.0% |
| Colville | 0.0 /100 | #326 | Tragic 13.0% |
| Yakama | 0.0 /100 | #327 | Tragic 13.1% |
| Central American Indians | 0.0 /100 | #328 | Tragic 13.3% |
| Blacks/African Americans | 0.0 /100 | #329 | Tragic 13.3% |
| Natives/Alaskans | 0.0 /100 | #330 | Tragic 14.3% |
| Cheyenne | 0.0 /100 | #331 | Tragic 14.3% |
| Dominicans | 0.0 /100 | #332 | Tragic 14.3% |
| Immigrants | Dominican Republic | 0.0 /100 | #333 | Tragic 14.4% |
| Houma | 0.0 /100 | #334 | Tragic 14.6% |
| Apache | 0.0 /100 | #335 | Tragic 14.7% |