Navajo vs Immigrants from Morocco Child Poverty Under the Age of 5
COMPARE
Navajo
Immigrants from Morocco
Child Poverty Under the Age of 5
Child Poverty Under the Age of 5 Comparison
Navajo
Immigrants from Morocco
31.6%
CHILD POVERTY UNDER THE AGE OF 5
0.0/ 100
METRIC RATING
345th/ 347
METRIC RANK
17.1%
CHILD POVERTY UNDER THE AGE OF 5
58.9/ 100
METRIC RATING
171st/ 347
METRIC RANK
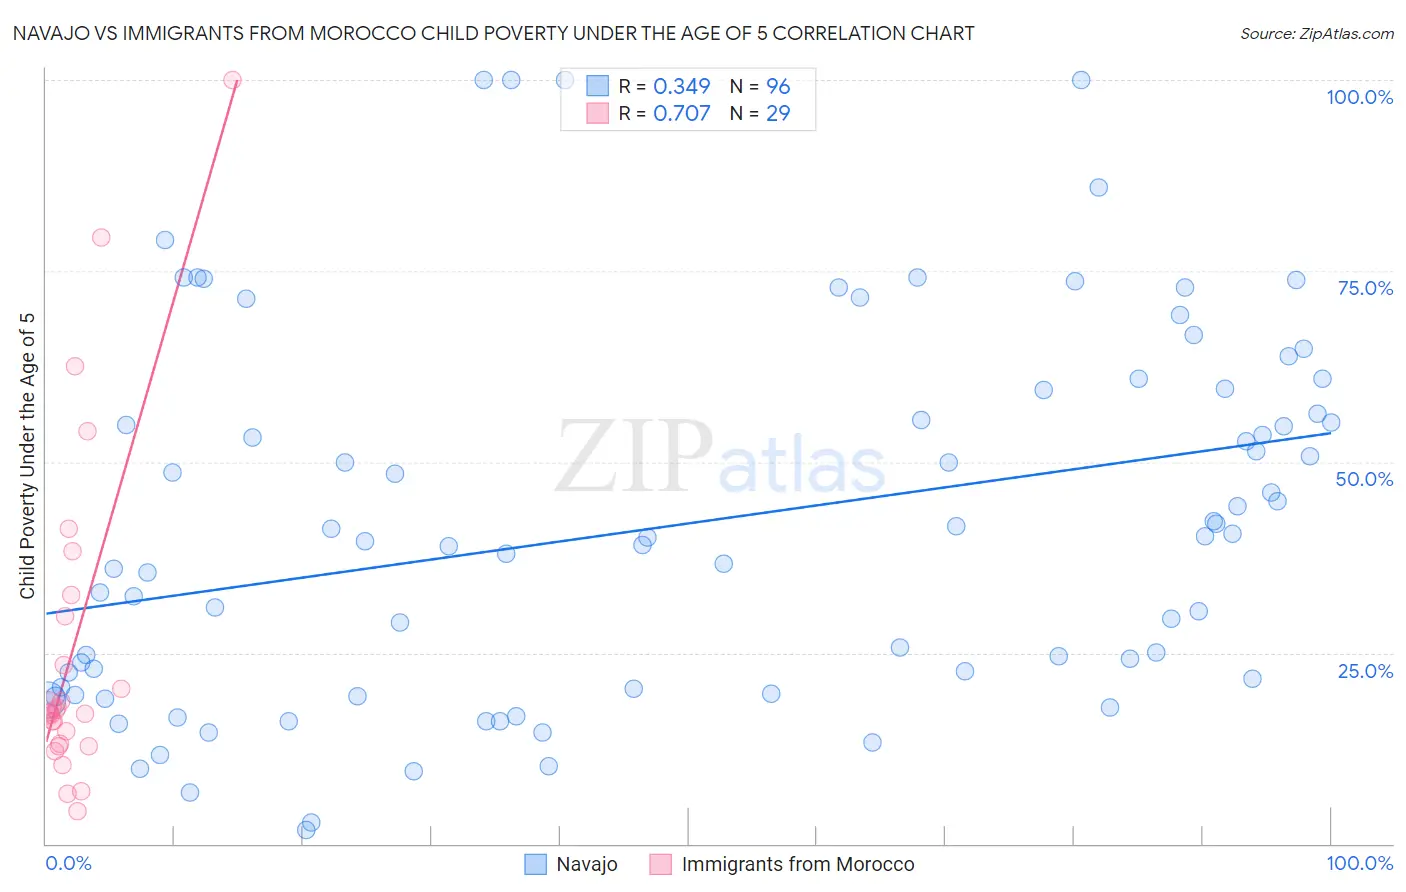
Navajo vs Immigrants from Morocco Child Poverty Under the Age of 5 Correlation Chart
The statistical analysis conducted on geographies consisting of 221,390,478 people shows a mild positive correlation between the proportion of Navajo and poverty level among children under the age of 5 in the United States with a correlation coefficient (R) of 0.349 and weighted average of 31.6%. Similarly, the statistical analysis conducted on geographies consisting of 175,526,639 people shows a strong positive correlation between the proportion of Immigrants from Morocco and poverty level among children under the age of 5 in the United States with a correlation coefficient (R) of 0.707 and weighted average of 17.1%, a difference of 85.1%.
Child Poverty Under the Age of 5 Correlation Summary
| Measurement | Navajo | Immigrants from Morocco |
| Minimum | 1.8% | 4.3% |
| Maximum | 100.0% | 100.0% |
| Range | 98.2% | 95.7% |
| Mean | 41.8% | 25.8% |
| Median | 39.9% | 17.2% |
| Interquartile 25% (IQ1) | 20.4% | 13.0% |
| Interquartile 75% (IQ3) | 57.8% | 31.2% |
| Interquartile Range (IQR) | 37.4% | 18.2% |
| Standard Deviation (Sample) | 24.2% | 22.4% |
| Standard Deviation (Population) | 24.0% | 22.0% |
Similar Demographics by Child Poverty Under the Age of 5
Demographics Similar to Navajo by Child Poverty Under the Age of 5
In terms of child poverty under the age of 5, the demographic groups most similar to Navajo are Crow (31.0%, a difference of 1.9%), Lumbee (33.3%, a difference of 5.4%), Yuman (29.5%, a difference of 6.9%), Tohono O'odham (29.5%, a difference of 7.1%), and Immigrants from Yemen (29.3%, a difference of 7.8%).
| Demographics | Rating | Rank | Child Poverty Under the Age of 5 |
| Natives/Alaskans | 0.0 /100 | #333 | Tragic 25.6% |
| Blacks/African Americans | 0.0 /100 | #334 | Tragic 25.7% |
| Colville | 0.0 /100 | #335 | Tragic 25.7% |
| Sioux | 0.0 /100 | #336 | Tragic 26.9% |
| Pima | 0.0 /100 | #337 | Tragic 27.4% |
| Hopi | 0.0 /100 | #338 | Tragic 27.7% |
| Yup'ik | 0.0 /100 | #339 | Tragic 27.7% |
| Cheyenne | 0.0 /100 | #340 | Tragic 28.3% |
| Immigrants | Yemen | 0.0 /100 | #341 | Tragic 29.3% |
| Tohono O'odham | 0.0 /100 | #342 | Tragic 29.5% |
| Yuman | 0.0 /100 | #343 | Tragic 29.5% |
| Crow | 0.0 /100 | #344 | Tragic 31.0% |
| Navajo | 0.0 /100 | #345 | Tragic 31.6% |
| Lumbee | 0.0 /100 | #346 | Tragic 33.3% |
| Puerto Ricans | 0.0 /100 | #347 | Tragic 34.5% |
Demographics Similar to Immigrants from Morocco by Child Poverty Under the Age of 5
In terms of child poverty under the age of 5, the demographic groups most similar to Immigrants from Morocco are Immigrants from Western Asia (17.1%, a difference of 0.030%), Immigrants from South America (17.1%, a difference of 0.12%), Uruguayan (17.0%, a difference of 0.17%), Immigrants from Uzbekistan (17.0%, a difference of 0.33%), and Yugoslavian (17.2%, a difference of 0.51%).
| Demographics | Rating | Rank | Child Poverty Under the Age of 5 |
| Immigrants | Oceania | 67.6 /100 | #164 | Good 16.9% |
| Immigrants | Colombia | 66.9 /100 | #165 | Good 16.9% |
| Slavs | 64.0 /100 | #166 | Good 17.0% |
| Immigrants | Uzbekistan | 62.0 /100 | #167 | Good 17.0% |
| Uruguayans | 60.5 /100 | #168 | Good 17.0% |
| Immigrants | South America | 60.0 /100 | #169 | Good 17.1% |
| Immigrants | Western Asia | 59.2 /100 | #170 | Average 17.1% |
| Immigrants | Morocco | 58.9 /100 | #171 | Average 17.1% |
| Yugoslavians | 54.1 /100 | #172 | Average 17.2% |
| Welsh | 54.0 /100 | #173 | Average 17.2% |
| Immigrants | Saudi Arabia | 50.0 /100 | #174 | Average 17.2% |
| Immigrants | Lebanon | 47.6 /100 | #175 | Average 17.3% |
| Immigrants | Iraq | 45.2 /100 | #176 | Average 17.3% |
| Immigrants | Sierra Leone | 43.6 /100 | #177 | Average 17.3% |
| Immigrants | Cameroon | 42.7 /100 | #178 | Average 17.4% |