Immigrants from the Azores vs Immigrants from Morocco Child Poverty Under the Age of 5
COMPARE
Immigrants from the Azores
Immigrants from Morocco
Child Poverty Under the Age of 5
Child Poverty Under the Age of 5 Comparison
Immigrants from the Azores
Immigrants from Morocco
18.9%
CHILD POVERTY UNDER THE AGE OF 5
2.6/ 100
METRIC RATING
220th/ 347
METRIC RANK
17.1%
CHILD POVERTY UNDER THE AGE OF 5
58.9/ 100
METRIC RATING
171st/ 347
METRIC RANK
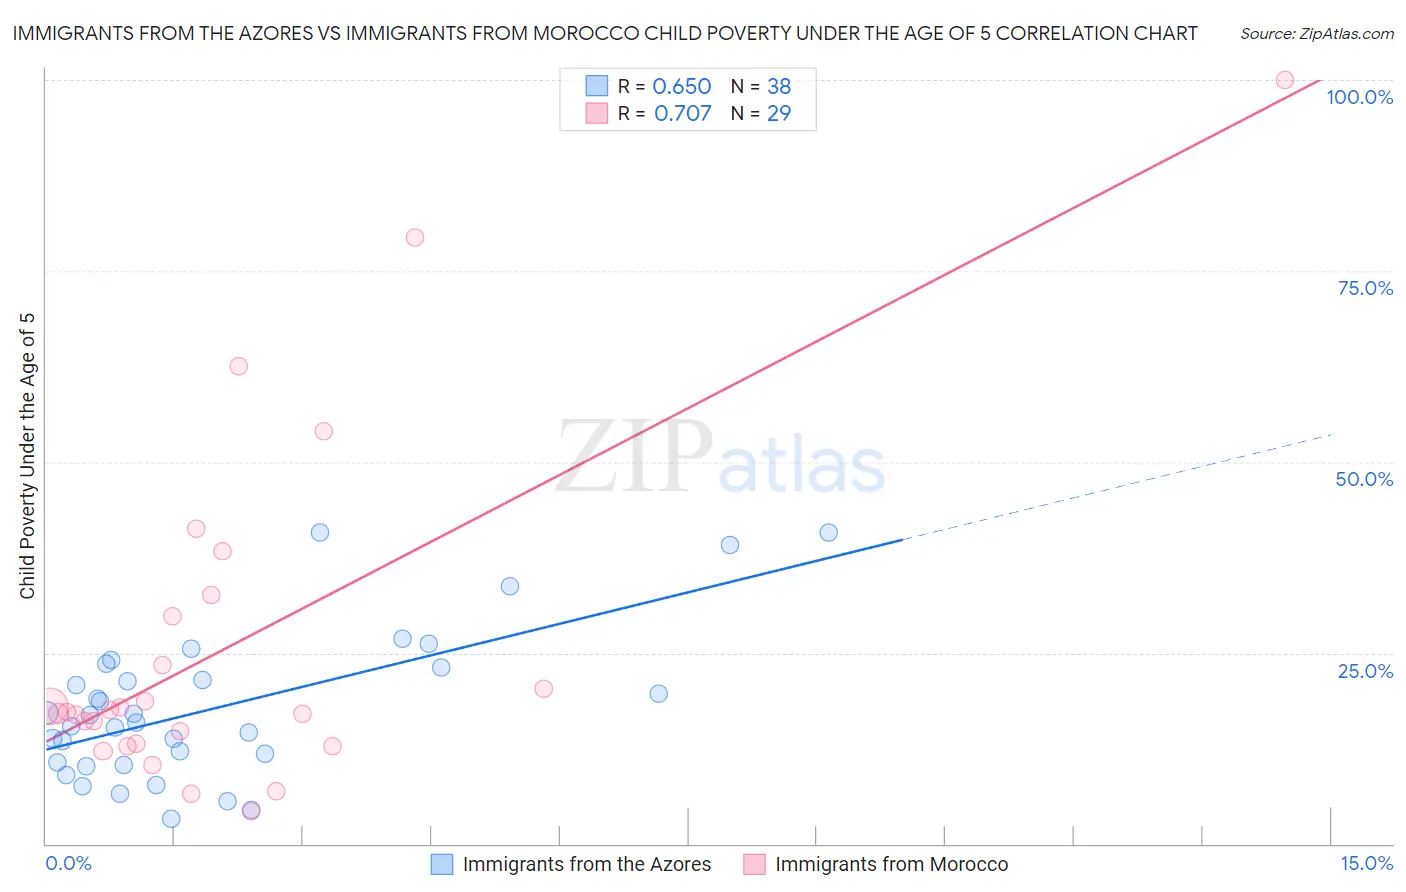
Immigrants from the Azores vs Immigrants from Morocco Child Poverty Under the Age of 5 Correlation Chart
The statistical analysis conducted on geographies consisting of 45,317,352 people shows a significant positive correlation between the proportion of Immigrants from the Azores and poverty level among children under the age of 5 in the United States with a correlation coefficient (R) of 0.650 and weighted average of 18.9%. Similarly, the statistical analysis conducted on geographies consisting of 175,526,639 people shows a strong positive correlation between the proportion of Immigrants from Morocco and poverty level among children under the age of 5 in the United States with a correlation coefficient (R) of 0.707 and weighted average of 17.1%, a difference of 10.4%.
Child Poverty Under the Age of 5 Correlation Summary
| Measurement | Immigrants from the Azores | Immigrants from Morocco |
| Minimum | 3.3% | 4.3% |
| Maximum | 40.8% | 100.0% |
| Range | 37.5% | 95.7% |
| Mean | 17.8% | 25.8% |
| Median | 16.4% | 17.2% |
| Interquartile 25% (IQ1) | 10.6% | 13.0% |
| Interquartile 75% (IQ3) | 23.2% | 31.2% |
| Interquartile Range (IQR) | 12.6% | 18.2% |
| Standard Deviation (Sample) | 9.6% | 22.4% |
| Standard Deviation (Population) | 9.4% | 22.0% |
Similar Demographics by Child Poverty Under the Age of 5
Demographics Similar to Immigrants from the Azores by Child Poverty Under the Age of 5
In terms of child poverty under the age of 5, the demographic groups most similar to Immigrants from the Azores are German Russian (18.8%, a difference of 0.36%), Immigrants from Nigeria (19.0%, a difference of 0.56%), Delaware (18.7%, a difference of 0.67%), Alsatian (19.1%, a difference of 1.1%), and Cuban (19.1%, a difference of 1.1%).
| Demographics | Rating | Rank | Child Poverty Under the Age of 5 |
| Immigrants | Thailand | 8.6 /100 | #213 | Tragic 18.3% |
| Malaysians | 6.5 /100 | #214 | Tragic 18.4% |
| Immigrants | Panama | 6.0 /100 | #215 | Tragic 18.5% |
| Hmong | 5.0 /100 | #216 | Tragic 18.5% |
| Immigrants | Africa | 4.6 /100 | #217 | Tragic 18.6% |
| Delaware | 3.4 /100 | #218 | Tragic 18.7% |
| German Russians | 3.0 /100 | #219 | Tragic 18.8% |
| Immigrants | Azores | 2.6 /100 | #220 | Tragic 18.9% |
| Immigrants | Nigeria | 2.1 /100 | #221 | Tragic 19.0% |
| Alsatians | 1.7 /100 | #222 | Tragic 19.1% |
| Cubans | 1.7 /100 | #223 | Tragic 19.1% |
| Nicaraguans | 1.6 /100 | #224 | Tragic 19.1% |
| Nigerians | 1.6 /100 | #225 | Tragic 19.1% |
| Immigrants | Eritrea | 1.5 /100 | #226 | Tragic 19.1% |
| Cape Verdeans | 1.4 /100 | #227 | Tragic 19.1% |
Demographics Similar to Immigrants from Morocco by Child Poverty Under the Age of 5
In terms of child poverty under the age of 5, the demographic groups most similar to Immigrants from Morocco are Immigrants from Western Asia (17.1%, a difference of 0.030%), Immigrants from South America (17.1%, a difference of 0.12%), Uruguayan (17.0%, a difference of 0.17%), Immigrants from Uzbekistan (17.0%, a difference of 0.33%), and Yugoslavian (17.2%, a difference of 0.51%).
| Demographics | Rating | Rank | Child Poverty Under the Age of 5 |
| Immigrants | Oceania | 67.6 /100 | #164 | Good 16.9% |
| Immigrants | Colombia | 66.9 /100 | #165 | Good 16.9% |
| Slavs | 64.0 /100 | #166 | Good 17.0% |
| Immigrants | Uzbekistan | 62.0 /100 | #167 | Good 17.0% |
| Uruguayans | 60.5 /100 | #168 | Good 17.0% |
| Immigrants | South America | 60.0 /100 | #169 | Good 17.1% |
| Immigrants | Western Asia | 59.2 /100 | #170 | Average 17.1% |
| Immigrants | Morocco | 58.9 /100 | #171 | Average 17.1% |
| Yugoslavians | 54.1 /100 | #172 | Average 17.2% |
| Welsh | 54.0 /100 | #173 | Average 17.2% |
| Immigrants | Saudi Arabia | 50.0 /100 | #174 | Average 17.2% |
| Immigrants | Lebanon | 47.6 /100 | #175 | Average 17.3% |
| Immigrants | Iraq | 45.2 /100 | #176 | Average 17.3% |
| Immigrants | Sierra Leone | 43.6 /100 | #177 | Average 17.3% |
| Immigrants | Cameroon | 42.7 /100 | #178 | Average 17.4% |