British West Indian vs Immigrants from Morocco Median Earnings
COMPARE
British West Indian
Immigrants from Morocco
Median Earnings
Median Earnings Comparison
British West Indians
Immigrants from Morocco
$44,552
MEDIAN EARNINGS
6.7/ 100
METRIC RATING
236th/ 347
METRIC RANK
$49,368
MEDIAN EARNINGS
98.4/ 100
METRIC RATING
107th/ 347
METRIC RANK
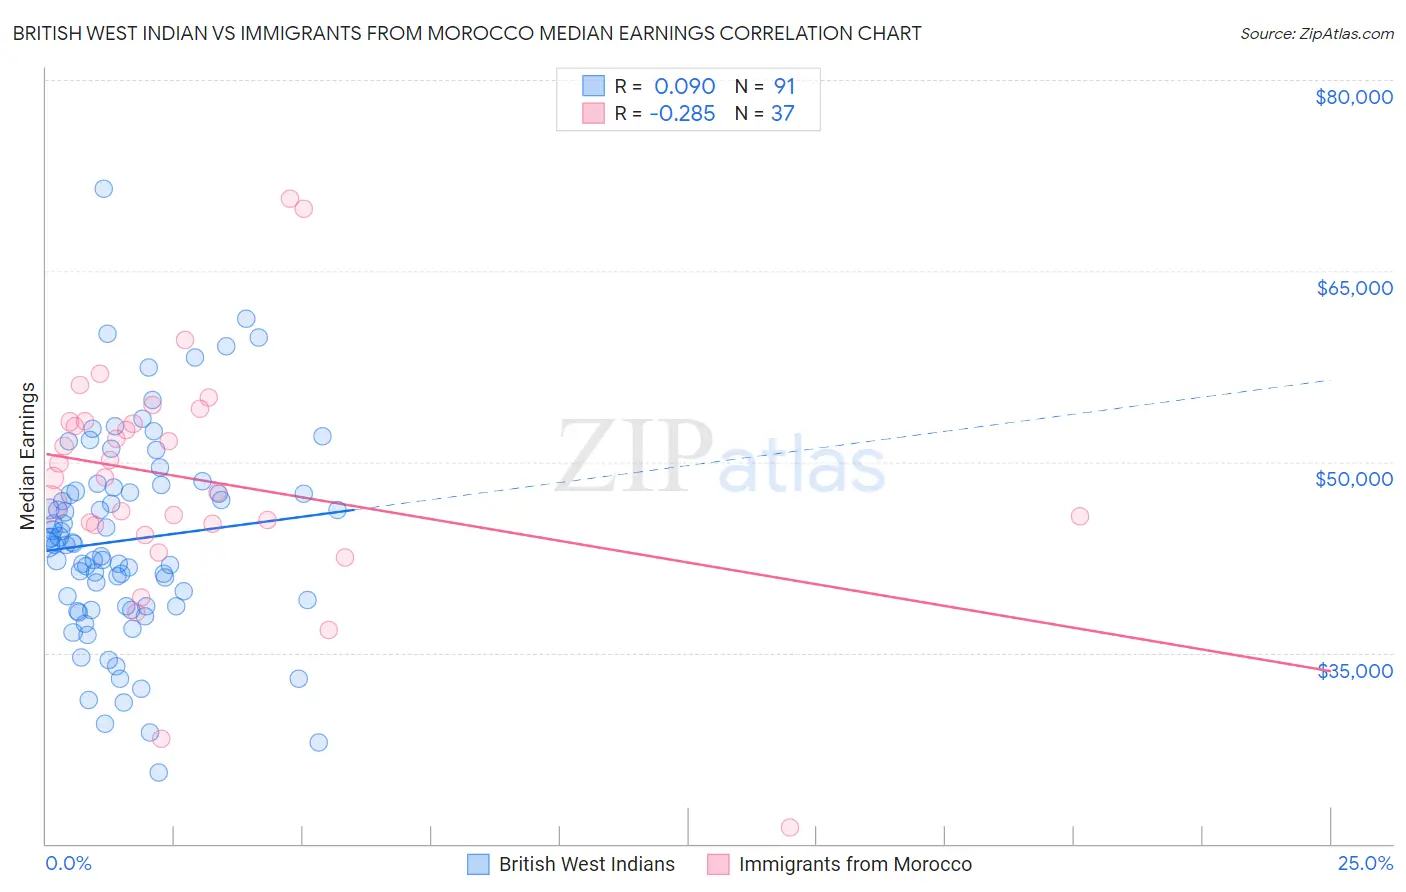
British West Indian vs Immigrants from Morocco Median Earnings Correlation Chart
The statistical analysis conducted on geographies consisting of 152,701,918 people shows a slight positive correlation between the proportion of British West Indians and median earnings in the United States with a correlation coefficient (R) of 0.090 and weighted average of $44,552. Similarly, the statistical analysis conducted on geographies consisting of 178,911,278 people shows a weak negative correlation between the proportion of Immigrants from Morocco and median earnings in the United States with a correlation coefficient (R) of -0.285 and weighted average of $49,368, a difference of 10.8%.
Median Earnings Correlation Summary
| Measurement | British West Indian | Immigrants from Morocco |
| Minimum | $25,617 | $21,250 |
| Maximum | $71,446 | $70,625 |
| Range | $45,829 | $49,375 |
| Mean | $43,859 | $48,644 |
| Median | $43,512 | $48,771 |
| Interquartile 25% (IQ1) | $38,648 | $45,090 |
| Interquartile 75% (IQ3) | $47,645 | $53,191 |
| Interquartile Range (IQR) | $8,997 | $8,101 |
| Standard Deviation (Sample) | $7,987 | $9,241 |
| Standard Deviation (Population) | $7,943 | $9,116 |
Similar Demographics by Median Earnings
Demographics Similar to British West Indians by Median Earnings
In terms of median earnings, the demographic groups most similar to British West Indians are Venezuelan ($44,580, a difference of 0.060%), Cape Verdean ($44,640, a difference of 0.20%), Immigrants from Ecuador ($44,462, a difference of 0.20%), Sudanese ($44,419, a difference of 0.30%), and Senegalese ($44,373, a difference of 0.40%).
| Demographics | Rating | Rank | Median Earnings |
| Scotch-Irish | 10.7 /100 | #229 | Poor $44,924 |
| Immigrants | Western Africa | 10.3 /100 | #230 | Poor $44,893 |
| Japanese | 9.5 /100 | #231 | Tragic $44,825 |
| Delaware | 9.0 /100 | #232 | Tragic $44,783 |
| Immigrants | Sudan | 8.8 /100 | #233 | Tragic $44,767 |
| Cape Verdeans | 7.5 /100 | #234 | Tragic $44,640 |
| Venezuelans | 6.9 /100 | #235 | Tragic $44,580 |
| British West Indians | 6.7 /100 | #236 | Tragic $44,552 |
| Immigrants | Ecuador | 5.9 /100 | #237 | Tragic $44,462 |
| Sudanese | 5.6 /100 | #238 | Tragic $44,419 |
| Senegalese | 5.3 /100 | #239 | Tragic $44,373 |
| Aleuts | 4.4 /100 | #240 | Tragic $44,241 |
| Samoans | 4.2 /100 | #241 | Tragic $44,206 |
| Immigrants | Venezuela | 4.0 /100 | #242 | Tragic $44,163 |
| Sub-Saharan Africans | 3.7 /100 | #243 | Tragic $44,118 |
Demographics Similar to Immigrants from Morocco by Median Earnings
In terms of median earnings, the demographic groups most similar to Immigrants from Morocco are Immigrants from Albania ($49,377, a difference of 0.020%), Immigrants from Western Asia ($49,389, a difference of 0.040%), Immigrants from Brazil ($49,463, a difference of 0.19%), Austrian ($49,501, a difference of 0.27%), and Palestinian ($49,209, a difference of 0.32%).
| Demographics | Rating | Rank | Median Earnings |
| Immigrants | Poland | 98.9 /100 | #100 | Exceptional $49,633 |
| Jordanians | 98.9 /100 | #101 | Exceptional $49,632 |
| Ethiopians | 98.8 /100 | #102 | Exceptional $49,572 |
| Austrians | 98.7 /100 | #103 | Exceptional $49,501 |
| Immigrants | Brazil | 98.6 /100 | #104 | Exceptional $49,463 |
| Immigrants | Western Asia | 98.4 /100 | #105 | Exceptional $49,389 |
| Immigrants | Albania | 98.4 /100 | #106 | Exceptional $49,377 |
| Immigrants | Morocco | 98.4 /100 | #107 | Exceptional $49,368 |
| Palestinians | 98.0 /100 | #108 | Exceptional $49,209 |
| Syrians | 97.1 /100 | #109 | Exceptional $48,934 |
| Immigrants | Ethiopia | 97.1 /100 | #110 | Exceptional $48,924 |
| Immigrants | Zimbabwe | 97.0 /100 | #111 | Exceptional $48,913 |
| Northern Europeans | 96.9 /100 | #112 | Exceptional $48,887 |
| Immigrants | Kuwait | 96.8 /100 | #113 | Exceptional $48,861 |
| Moroccans | 96.7 /100 | #114 | Exceptional $48,838 |