British vs Yugoslavian Single Father Poverty
COMPARE
British
Yugoslavian
Single Father Poverty
Single Father Poverty Comparison
British
Yugoslavians
16.8%
SINGLE FATHER POVERTY
5.6/ 100
METRIC RATING
227th/ 347
METRIC RANK
16.3%
SINGLE FATHER POVERTY
53.9/ 100
METRIC RATING
167th/ 347
METRIC RANK
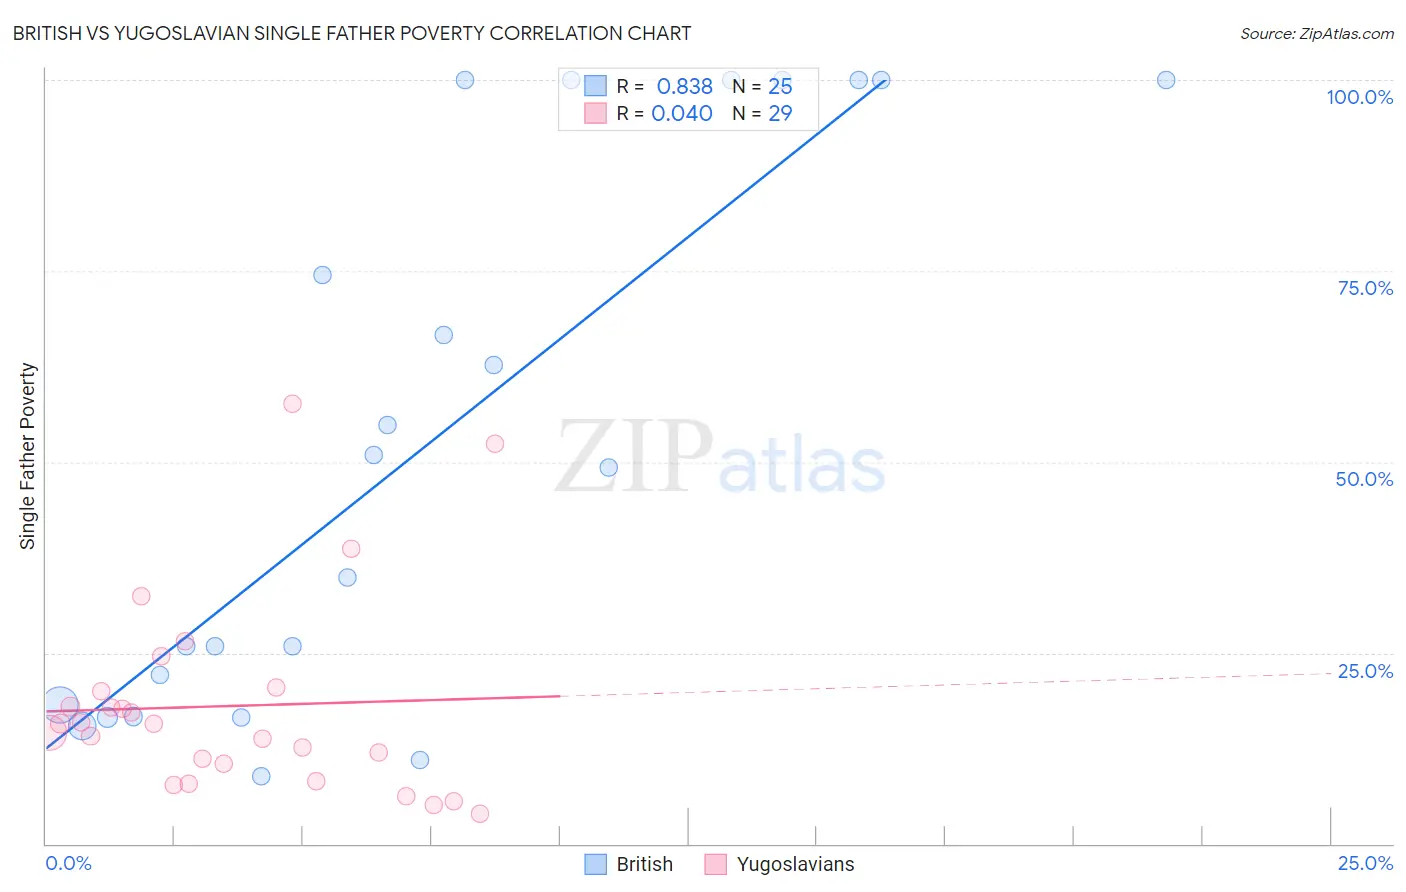
British vs Yugoslavian Single Father Poverty Correlation Chart
The statistical analysis conducted on geographies consisting of 389,691,429 people shows a very strong positive correlation between the proportion of British and poverty level among single fathers in the United States with a correlation coefficient (R) of 0.838 and weighted average of 16.8%. Similarly, the statistical analysis conducted on geographies consisting of 233,019,111 people shows no correlation between the proportion of Yugoslavians and poverty level among single fathers in the United States with a correlation coefficient (R) of 0.040 and weighted average of 16.3%, a difference of 3.3%.
Single Father Poverty Correlation Summary
| Measurement | British | Yugoslavian |
| Minimum | 8.8% | 4.0% |
| Maximum | 100.0% | 57.7% |
| Range | 91.2% | 53.7% |
| Mean | 51.9% | 18.0% |
| Median | 49.3% | 15.7% |
| Interquartile 25% (IQ1) | 17.4% | 9.3% |
| Interquartile 75% (IQ3) | 100.0% | 20.2% |
| Interquartile Range (IQR) | 82.6% | 10.9% |
| Standard Deviation (Sample) | 35.4% | 13.0% |
| Standard Deviation (Population) | 34.6% | 12.8% |
Similar Demographics by Single Father Poverty
Demographics Similar to British by Single Father Poverty
In terms of single father poverty, the demographic groups most similar to British are Belgian (16.8%, a difference of 0.070%), Hispanic or Latino (16.8%, a difference of 0.10%), Menominee (16.8%, a difference of 0.15%), Immigrants from Norway (16.8%, a difference of 0.16%), and Israeli (16.8%, a difference of 0.22%).
| Demographics | Rating | Rank | Single Father Poverty |
| Immigrants | Denmark | 8.1 /100 | #220 | Tragic 16.7% |
| Immigrants | Greece | 8.1 /100 | #221 | Tragic 16.7% |
| Immigrants | Spain | 8.0 /100 | #222 | Tragic 16.7% |
| Immigrants | Austria | 7.0 /100 | #223 | Tragic 16.8% |
| Immigrants | Norway | 6.5 /100 | #224 | Tragic 16.8% |
| Menominee | 6.4 /100 | #225 | Tragic 16.8% |
| Hispanics or Latinos | 6.1 /100 | #226 | Tragic 16.8% |
| British | 5.6 /100 | #227 | Tragic 16.8% |
| Belgians | 5.3 /100 | #228 | Tragic 16.8% |
| Israelis | 4.6 /100 | #229 | Tragic 16.8% |
| Immigrants | Trinidad and Tobago | 4.5 /100 | #230 | Tragic 16.8% |
| Spanish Americans | 3.7 /100 | #231 | Tragic 16.9% |
| Immigrants | Grenada | 3.7 /100 | #232 | Tragic 16.9% |
| Senegalese | 3.2 /100 | #233 | Tragic 16.9% |
| Marshallese | 3.1 /100 | #234 | Tragic 16.9% |
Demographics Similar to Yugoslavians by Single Father Poverty
In terms of single father poverty, the demographic groups most similar to Yugoslavians are Costa Rican (16.3%, a difference of 0.010%), Immigrants from Europe (16.3%, a difference of 0.040%), Immigrants from Bangladesh (16.3%, a difference of 0.050%), Northern European (16.3%, a difference of 0.050%), and Guyanese (16.3%, a difference of 0.060%).
| Demographics | Rating | Rank | Single Father Poverty |
| Immigrants | Sudan | 59.8 /100 | #160 | Average 16.2% |
| Estonians | 56.7 /100 | #161 | Average 16.2% |
| Ugandans | 55.9 /100 | #162 | Average 16.3% |
| Immigrants | Costa Rica | 55.7 /100 | #163 | Average 16.3% |
| Guyanese | 55.2 /100 | #164 | Average 16.3% |
| Immigrants | Bangladesh | 55.1 /100 | #165 | Average 16.3% |
| Immigrants | Europe | 54.8 /100 | #166 | Average 16.3% |
| Yugoslavians | 53.9 /100 | #167 | Average 16.3% |
| Costa Ricans | 53.6 /100 | #168 | Average 16.3% |
| Northern Europeans | 52.8 /100 | #169 | Average 16.3% |
| Scandinavians | 52.3 /100 | #170 | Average 16.3% |
| Immigrants | Morocco | 50.7 /100 | #171 | Average 16.3% |
| Immigrants | Sierra Leone | 50.1 /100 | #172 | Average 16.3% |
| Immigrants | St. Vincent and the Grenadines | 50.0 /100 | #173 | Average 16.3% |
| Swedes | 50.0 /100 | #174 | Average 16.3% |