British vs Immigrants from Cambodia Single Father Poverty
COMPARE
British
Immigrants from Cambodia
Single Father Poverty
Single Father Poverty Comparison
British
Immigrants from Cambodia
16.8%
SINGLE FATHER POVERTY
5.6/ 100
METRIC RATING
227th/ 347
METRIC RANK
14.9%
SINGLE FATHER POVERTY
99.9/ 100
METRIC RATING
46th/ 347
METRIC RANK
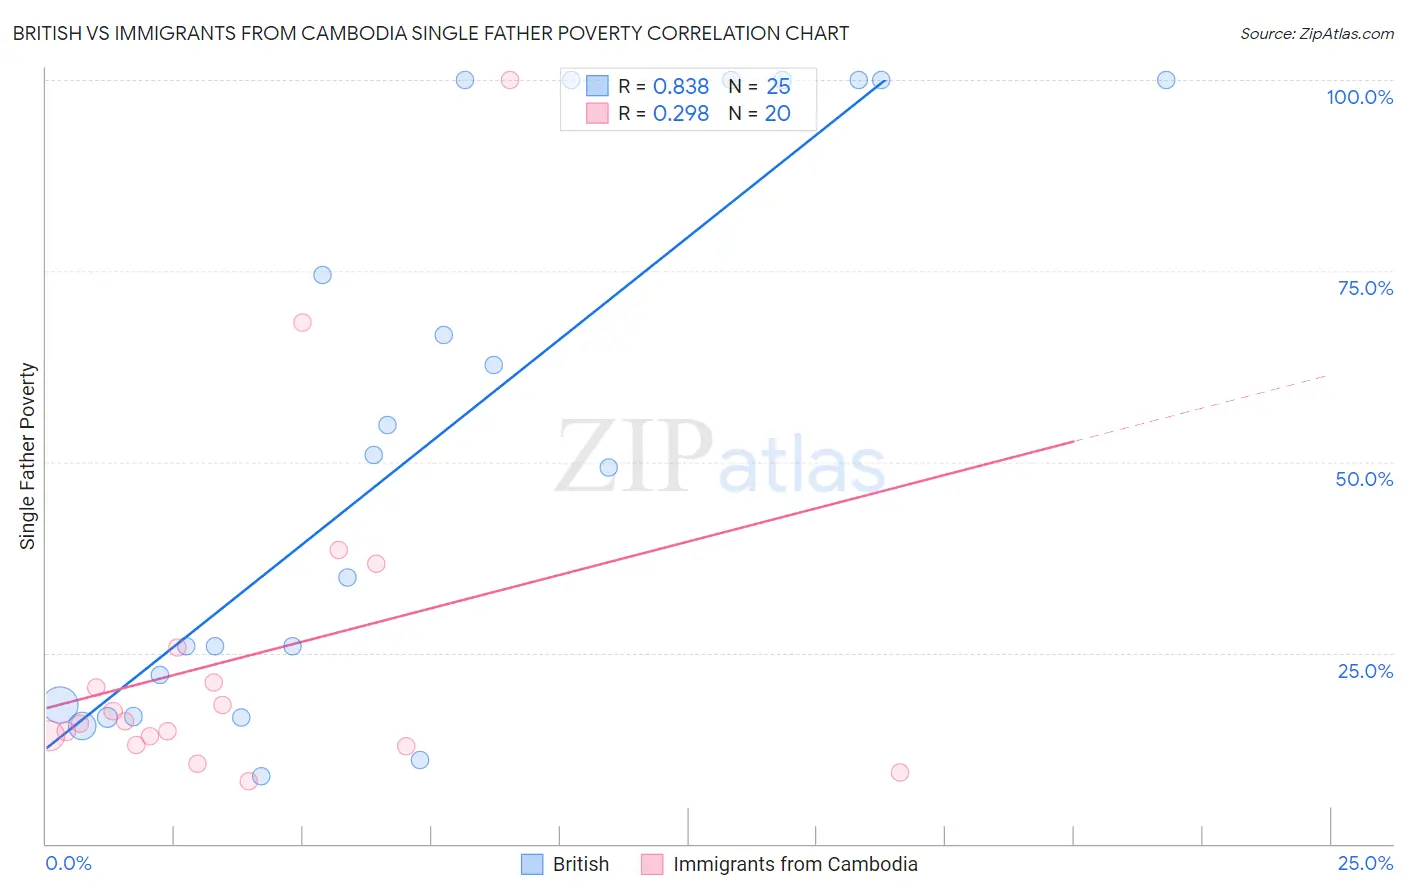
British vs Immigrants from Cambodia Single Father Poverty Correlation Chart
The statistical analysis conducted on geographies consisting of 389,691,429 people shows a very strong positive correlation between the proportion of British and poverty level among single fathers in the United States with a correlation coefficient (R) of 0.838 and weighted average of 16.8%. Similarly, the statistical analysis conducted on geographies consisting of 178,014,507 people shows a weak positive correlation between the proportion of Immigrants from Cambodia and poverty level among single fathers in the United States with a correlation coefficient (R) of 0.298 and weighted average of 14.9%, a difference of 12.5%.
Single Father Poverty Correlation Summary
| Measurement | British | Immigrants from Cambodia |
| Minimum | 8.8% | 8.1% |
| Maximum | 100.0% | 100.0% |
| Range | 91.2% | 91.9% |
| Mean | 51.9% | 24.5% |
| Median | 49.3% | 15.9% |
| Interquartile 25% (IQ1) | 17.4% | 13.6% |
| Interquartile 75% (IQ3) | 100.0% | 23.4% |
| Interquartile Range (IQR) | 82.6% | 9.8% |
| Standard Deviation (Sample) | 35.4% | 22.5% |
| Standard Deviation (Population) | 34.6% | 21.9% |
Similar Demographics by Single Father Poverty
Demographics Similar to British by Single Father Poverty
In terms of single father poverty, the demographic groups most similar to British are Belgian (16.8%, a difference of 0.070%), Hispanic or Latino (16.8%, a difference of 0.10%), Menominee (16.8%, a difference of 0.15%), Immigrants from Norway (16.8%, a difference of 0.16%), and Israeli (16.8%, a difference of 0.22%).
| Demographics | Rating | Rank | Single Father Poverty |
| Immigrants | Denmark | 8.1 /100 | #220 | Tragic 16.7% |
| Immigrants | Greece | 8.1 /100 | #221 | Tragic 16.7% |
| Immigrants | Spain | 8.0 /100 | #222 | Tragic 16.7% |
| Immigrants | Austria | 7.0 /100 | #223 | Tragic 16.8% |
| Immigrants | Norway | 6.5 /100 | #224 | Tragic 16.8% |
| Menominee | 6.4 /100 | #225 | Tragic 16.8% |
| Hispanics or Latinos | 6.1 /100 | #226 | Tragic 16.8% |
| British | 5.6 /100 | #227 | Tragic 16.8% |
| Belgians | 5.3 /100 | #228 | Tragic 16.8% |
| Israelis | 4.6 /100 | #229 | Tragic 16.8% |
| Immigrants | Trinidad and Tobago | 4.5 /100 | #230 | Tragic 16.8% |
| Spanish Americans | 3.7 /100 | #231 | Tragic 16.9% |
| Immigrants | Grenada | 3.7 /100 | #232 | Tragic 16.9% |
| Senegalese | 3.2 /100 | #233 | Tragic 16.9% |
| Marshallese | 3.1 /100 | #234 | Tragic 16.9% |
Demographics Similar to Immigrants from Cambodia by Single Father Poverty
In terms of single father poverty, the demographic groups most similar to Immigrants from Cambodia are Immigrants from China (14.9%, a difference of 0.030%), Malaysian (14.9%, a difference of 0.030%), Immigrants from Somalia (14.9%, a difference of 0.12%), Immigrants from Eastern Asia (15.0%, a difference of 0.19%), and Bhutanese (15.0%, a difference of 0.24%).
| Demographics | Rating | Rank | Single Father Poverty |
| Immigrants | Asia | 100.0 /100 | #39 | Exceptional 14.7% |
| Pima | 100.0 /100 | #40 | Exceptional 14.8% |
| Indians (Asian) | 100.0 /100 | #41 | Exceptional 14.8% |
| Immigrants | Nepal | 100.0 /100 | #42 | Exceptional 14.8% |
| Immigrants | Eritrea | 100.0 /100 | #43 | Exceptional 14.8% |
| Salvadorans | 100.0 /100 | #44 | Exceptional 14.9% |
| Immigrants | Somalia | 100.0 /100 | #45 | Exceptional 14.9% |
| Immigrants | Cambodia | 99.9 /100 | #46 | Exceptional 14.9% |
| Immigrants | China | 99.9 /100 | #47 | Exceptional 14.9% |
| Malaysians | 99.9 /100 | #48 | Exceptional 14.9% |
| Immigrants | Eastern Asia | 99.9 /100 | #49 | Exceptional 15.0% |
| Bhutanese | 99.9 /100 | #50 | Exceptional 15.0% |
| Immigrants | Pakistan | 99.9 /100 | #51 | Exceptional 15.0% |
| Immigrants | El Salvador | 99.9 /100 | #52 | Exceptional 15.0% |
| Immigrants | Kenya | 99.9 /100 | #53 | Exceptional 15.0% |