Italian vs Thai Single Father Poverty
COMPARE
Italian
Thai
Single Father Poverty
Single Father Poverty Comparison
Italians
Thais
17.5%
SINGLE FATHER POVERTY
0.1/ 100
METRIC RATING
273rd/ 347
METRIC RANK
14.5%
SINGLE FATHER POVERTY
100.0/ 100
METRIC RATING
30th/ 347
METRIC RANK
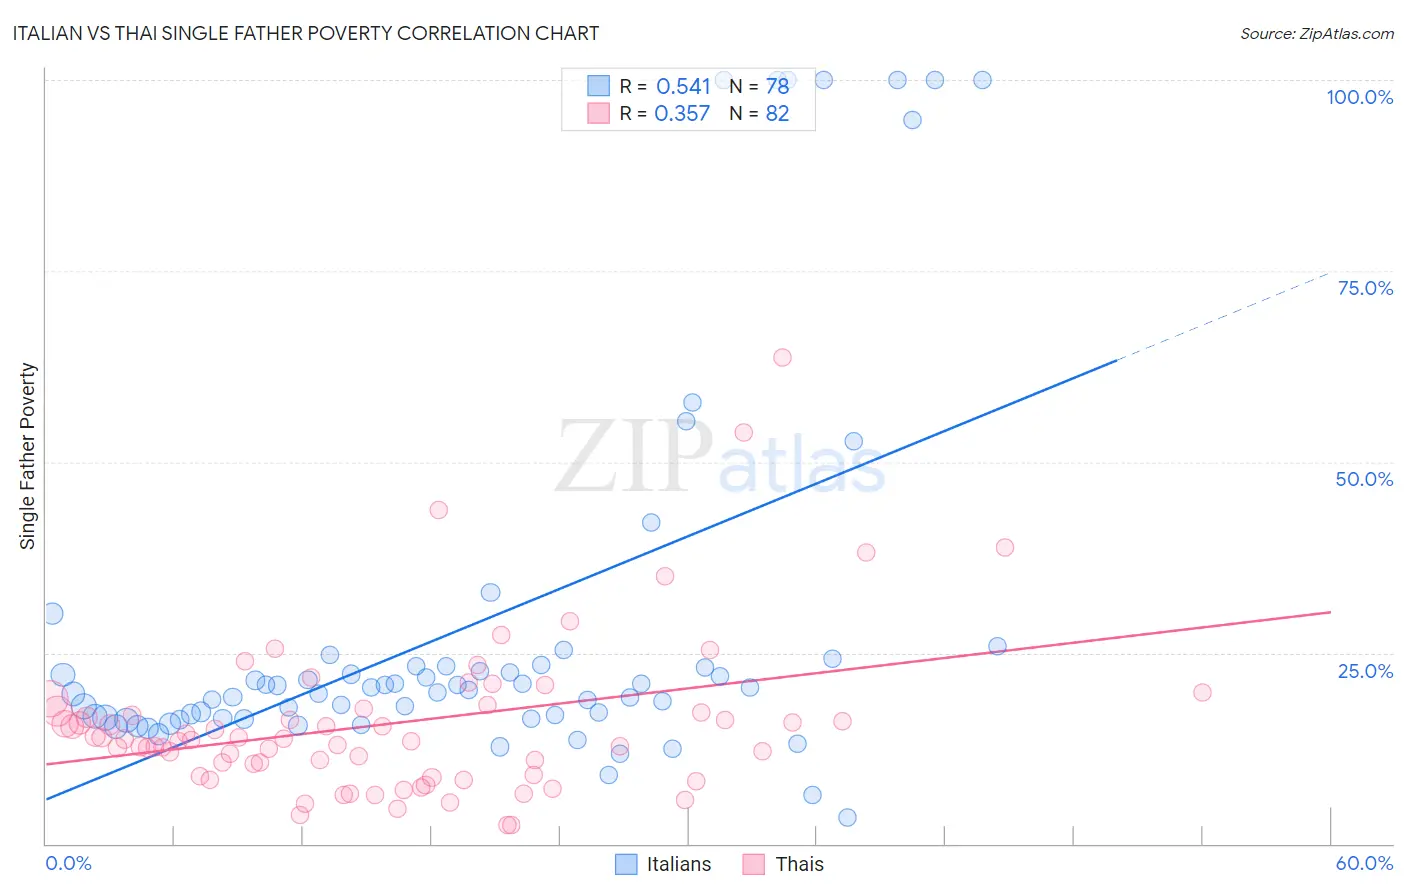
Italian vs Thai Single Father Poverty Correlation Chart
The statistical analysis conducted on geographies consisting of 411,059,801 people shows a substantial positive correlation between the proportion of Italians and poverty level among single fathers in the United States with a correlation coefficient (R) of 0.541 and weighted average of 17.5%. Similarly, the statistical analysis conducted on geographies consisting of 363,511,447 people shows a mild positive correlation between the proportion of Thais and poverty level among single fathers in the United States with a correlation coefficient (R) of 0.357 and weighted average of 14.5%, a difference of 20.8%.
Single Father Poverty Correlation Summary
| Measurement | Italian | Thai |
| Minimum | 3.4% | 2.5% |
| Maximum | 100.0% | 63.6% |
| Range | 96.6% | 61.2% |
| Mean | 28.7% | 15.7% |
| Median | 20.3% | 13.6% |
| Interquartile 25% (IQ1) | 16.4% | 9.0% |
| Interquartile 75% (IQ3) | 23.3% | 17.4% |
| Interquartile Range (IQR) | 6.9% | 8.4% |
| Standard Deviation (Sample) | 25.6% | 10.5% |
| Standard Deviation (Population) | 25.4% | 10.4% |
Similar Demographics by Single Father Poverty
Demographics Similar to Italians by Single Father Poverty
In terms of single father poverty, the demographic groups most similar to Italians are Barbadian (17.5%, a difference of 0.28%), French American Indian (17.4%, a difference of 0.63%), Macedonian (17.7%, a difference of 0.66%), British West Indian (17.7%, a difference of 0.72%), and Indonesian (17.4%, a difference of 0.77%).
| Demographics | Rating | Rank | Single Father Poverty |
| Jamaicans | 0.3 /100 | #266 | Tragic 17.3% |
| Haitians | 0.3 /100 | #267 | Tragic 17.3% |
| Immigrants | Caribbean | 0.3 /100 | #268 | Tragic 17.4% |
| Slavs | 0.3 /100 | #269 | Tragic 17.4% |
| Indonesians | 0.2 /100 | #270 | Tragic 17.4% |
| French American Indians | 0.2 /100 | #271 | Tragic 17.4% |
| Barbadians | 0.1 /100 | #272 | Tragic 17.5% |
| Italians | 0.1 /100 | #273 | Tragic 17.5% |
| Macedonians | 0.1 /100 | #274 | Tragic 17.7% |
| British West Indians | 0.0 /100 | #275 | Tragic 17.7% |
| German Russians | 0.0 /100 | #276 | Tragic 17.7% |
| Lebanese | 0.0 /100 | #277 | Tragic 17.7% |
| Germans | 0.0 /100 | #278 | Tragic 17.7% |
| Iroquois | 0.0 /100 | #279 | Tragic 17.7% |
| Scottish | 0.0 /100 | #280 | Tragic 17.7% |
Demographics Similar to Thais by Single Father Poverty
In terms of single father poverty, the demographic groups most similar to Thais are Somali (14.5%, a difference of 0.040%), Icelander (14.5%, a difference of 0.080%), Immigrants from South Central Asia (14.5%, a difference of 0.15%), Asian (14.6%, a difference of 0.24%), and Nepalese (14.4%, a difference of 0.68%).
| Demographics | Rating | Rank | Single Father Poverty |
| Immigrants | Egypt | 100.0 /100 | #23 | Exceptional 14.4% |
| Immigrants | South Eastern Asia | 100.0 /100 | #24 | Exceptional 14.4% |
| Iranians | 100.0 /100 | #25 | Exceptional 14.4% |
| Spanish American Indians | 100.0 /100 | #26 | Exceptional 14.4% |
| Nepalese | 100.0 /100 | #27 | Exceptional 14.4% |
| Immigrants | South Central Asia | 100.0 /100 | #28 | Exceptional 14.5% |
| Somalis | 100.0 /100 | #29 | Exceptional 14.5% |
| Thais | 100.0 /100 | #30 | Exceptional 14.5% |
| Icelanders | 100.0 /100 | #31 | Exceptional 14.5% |
| Asians | 100.0 /100 | #32 | Exceptional 14.6% |
| Okinawans | 100.0 /100 | #33 | Exceptional 14.6% |
| Egyptians | 100.0 /100 | #34 | Exceptional 14.7% |
| Immigrants | Bolivia | 100.0 /100 | #35 | Exceptional 14.7% |
| Immigrants | Indonesia | 100.0 /100 | #36 | Exceptional 14.7% |
| Immigrants | Eastern Africa | 100.0 /100 | #37 | Exceptional 14.7% |