Italian vs Immigrants from Greece Single Mother Poverty
COMPARE
Italian
Immigrants from Greece
Single Mother Poverty
Single Mother Poverty Comparison
Italians
Immigrants from Greece
28.0%
SINGLE MOTHER POVERTY
96.6/ 100
METRIC RATING
104th/ 347
METRIC RANK
26.7%
SINGLE MOTHER POVERTY
99.9/ 100
METRIC RATING
41st/ 347
METRIC RANK
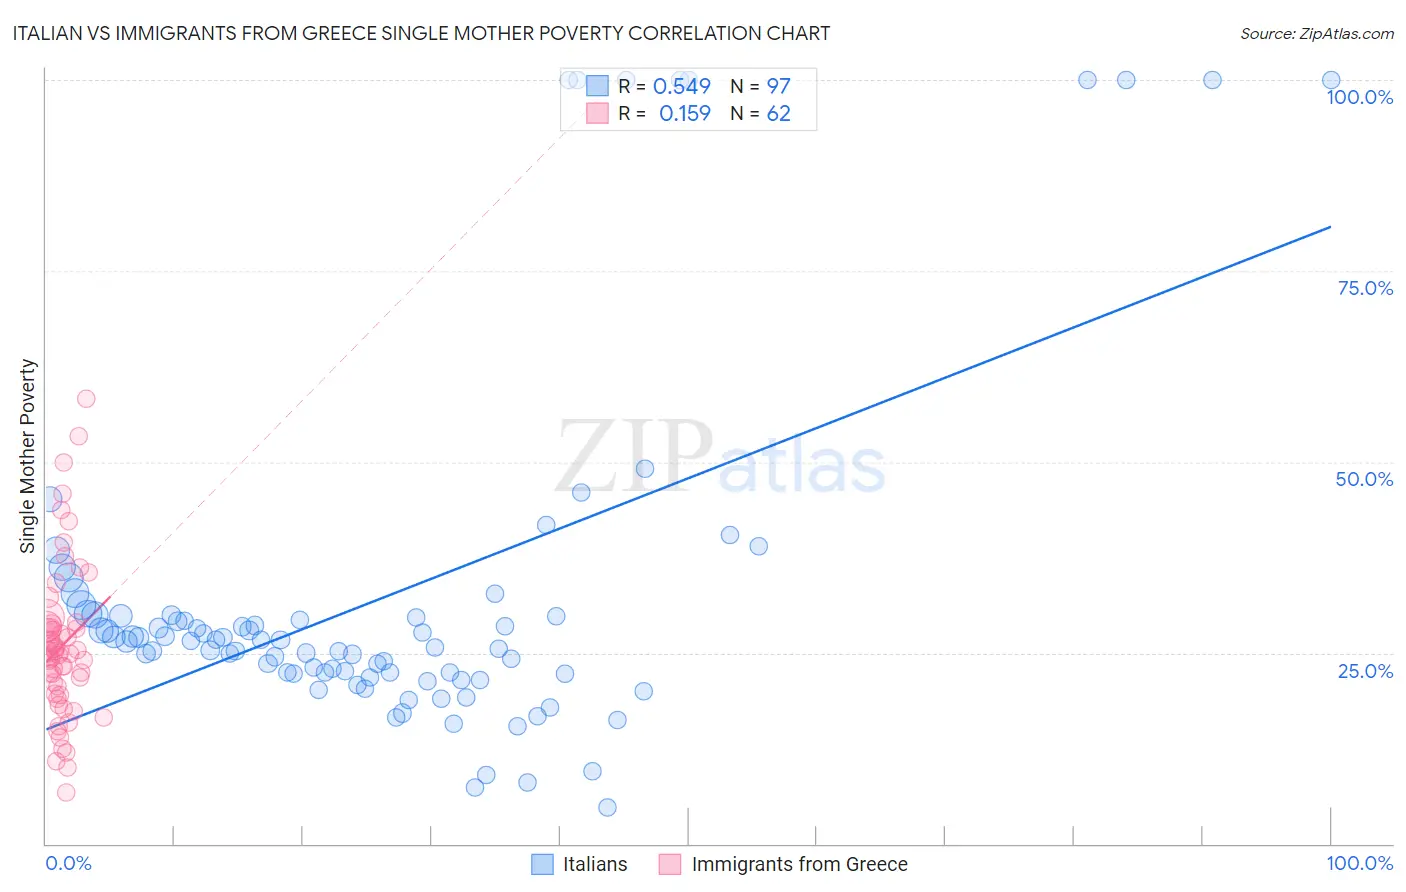
Italian vs Immigrants from Greece Single Mother Poverty Correlation Chart
The statistical analysis conducted on geographies consisting of 546,043,185 people shows a substantial positive correlation between the proportion of Italians and poverty level among single mothers in the United States with a correlation coefficient (R) of 0.549 and weighted average of 28.0%. Similarly, the statistical analysis conducted on geographies consisting of 212,076,443 people shows a poor positive correlation between the proportion of Immigrants from Greece and poverty level among single mothers in the United States with a correlation coefficient (R) of 0.159 and weighted average of 26.7%, a difference of 4.7%.
Single Mother Poverty Correlation Summary
| Measurement | Italian | Immigrants from Greece |
| Minimum | 4.7% | 6.7% |
| Maximum | 100.0% | 58.3% |
| Range | 95.3% | 51.6% |
| Mean | 32.3% | 25.9% |
| Median | 26.6% | 24.9% |
| Interquartile 25% (IQ1) | 22.3% | 19.6% |
| Interquartile 75% (IQ3) | 29.9% | 28.5% |
| Interquartile Range (IQR) | 7.6% | 8.9% |
| Standard Deviation (Sample) | 23.0% | 10.2% |
| Standard Deviation (Population) | 22.9% | 10.1% |
Similar Demographics by Single Mother Poverty
Demographics Similar to Italians by Single Mother Poverty
In terms of single mother poverty, the demographic groups most similar to Italians are Immigrants from Northern Africa (28.0%, a difference of 0.020%), Israeli (28.0%, a difference of 0.020%), Immigrants from Croatia (28.0%, a difference of 0.030%), Ukrainian (28.0%, a difference of 0.070%), and Pakistani (28.0%, a difference of 0.14%).
| Demographics | Rating | Rank | Single Mother Poverty |
| Immigrants | Brazil | 97.2 /100 | #97 | Exceptional 27.9% |
| Immigrants | Nepal | 97.2 /100 | #98 | Exceptional 27.9% |
| Immigrants | Netherlands | 97.2 /100 | #99 | Exceptional 27.9% |
| Zimbabweans | 97.1 /100 | #100 | Exceptional 27.9% |
| Pakistanis | 96.9 /100 | #101 | Exceptional 28.0% |
| Immigrants | Croatia | 96.7 /100 | #102 | Exceptional 28.0% |
| Immigrants | Northern Africa | 96.6 /100 | #103 | Exceptional 28.0% |
| Italians | 96.6 /100 | #104 | Exceptional 28.0% |
| Israelis | 96.5 /100 | #105 | Exceptional 28.0% |
| Ukrainians | 96.4 /100 | #106 | Exceptional 28.0% |
| Immigrants | Venezuela | 95.8 /100 | #107 | Exceptional 28.1% |
| Immigrants | Zimbabwe | 95.5 /100 | #108 | Exceptional 28.1% |
| Immigrants | Armenia | 95.2 /100 | #109 | Exceptional 28.1% |
| Croatians | 94.8 /100 | #110 | Exceptional 28.2% |
| Venezuelans | 94.5 /100 | #111 | Exceptional 28.2% |
Demographics Similar to Immigrants from Greece by Single Mother Poverty
In terms of single mother poverty, the demographic groups most similar to Immigrants from Greece are Immigrants from Vietnam (26.7%, a difference of 0.070%), Sri Lankan (26.7%, a difference of 0.17%), Armenian (26.8%, a difference of 0.23%), Tsimshian (26.8%, a difference of 0.31%), and Immigrants from Sierra Leone (26.9%, a difference of 0.45%).
| Demographics | Rating | Rank | Single Mother Poverty |
| Immigrants | Indonesia | 99.9 /100 | #34 | Exceptional 26.6% |
| Maltese | 99.9 /100 | #35 | Exceptional 26.6% |
| Okinawans | 99.9 /100 | #36 | Exceptional 26.6% |
| Immigrants | Israel | 99.9 /100 | #37 | Exceptional 26.6% |
| Immigrants | Fiji | 99.9 /100 | #38 | Exceptional 26.6% |
| Sri Lankans | 99.9 /100 | #39 | Exceptional 26.7% |
| Immigrants | Vietnam | 99.9 /100 | #40 | Exceptional 26.7% |
| Immigrants | Greece | 99.9 /100 | #41 | Exceptional 26.7% |
| Armenians | 99.9 /100 | #42 | Exceptional 26.8% |
| Tsimshian | 99.9 /100 | #43 | Exceptional 26.8% |
| Immigrants | Sierra Leone | 99.9 /100 | #44 | Exceptional 26.9% |
| Latvians | 99.9 /100 | #45 | Exceptional 26.9% |
| Immigrants | Serbia | 99.9 /100 | #46 | Exceptional 26.9% |
| Egyptians | 99.8 /100 | #47 | Exceptional 26.9% |
| Immigrants | Poland | 99.8 /100 | #48 | Exceptional 26.9% |