Osage vs Immigrants from Greece Single Mother Poverty
COMPARE
Osage
Immigrants from Greece
Single Mother Poverty
Single Mother Poverty Comparison
Osage
Immigrants from Greece
32.6%
SINGLE MOTHER POVERTY
0.0/ 100
METRIC RATING
290th/ 347
METRIC RANK
26.7%
SINGLE MOTHER POVERTY
99.9/ 100
METRIC RATING
41st/ 347
METRIC RANK
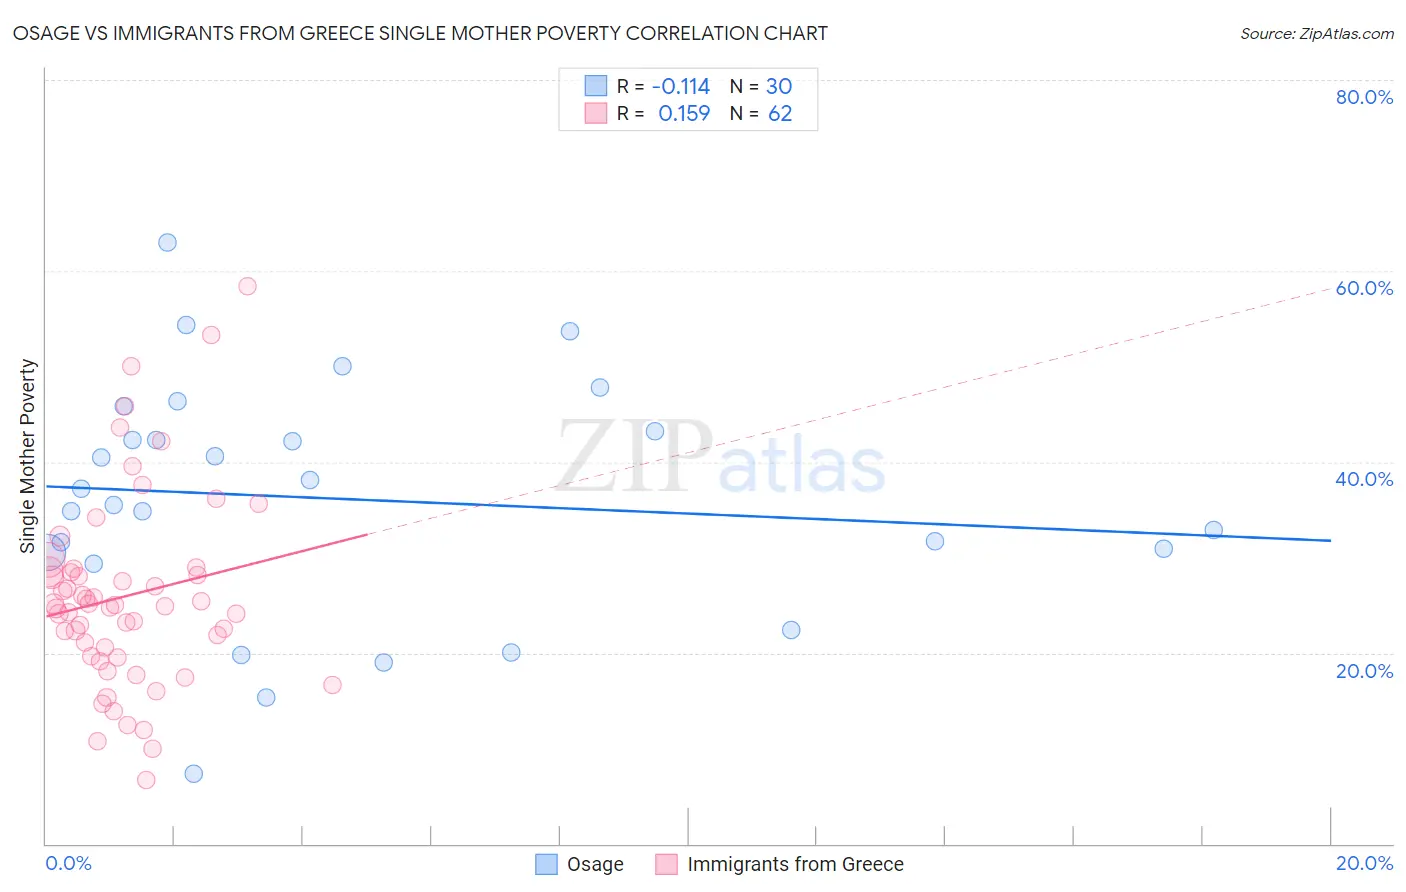
Osage vs Immigrants from Greece Single Mother Poverty Correlation Chart
The statistical analysis conducted on geographies consisting of 91,278,807 people shows a poor negative correlation between the proportion of Osage and poverty level among single mothers in the United States with a correlation coefficient (R) of -0.114 and weighted average of 32.6%. Similarly, the statistical analysis conducted on geographies consisting of 212,076,443 people shows a poor positive correlation between the proportion of Immigrants from Greece and poverty level among single mothers in the United States with a correlation coefficient (R) of 0.159 and weighted average of 26.7%, a difference of 21.9%.
Single Mother Poverty Correlation Summary
| Measurement | Osage | Immigrants from Greece |
| Minimum | 7.3% | 6.7% |
| Maximum | 63.0% | 58.3% |
| Range | 55.7% | 51.6% |
| Mean | 36.1% | 25.9% |
| Median | 36.3% | 24.9% |
| Interquartile 25% (IQ1) | 30.5% | 19.6% |
| Interquartile 75% (IQ3) | 43.2% | 28.5% |
| Interquartile Range (IQR) | 12.7% | 8.9% |
| Standard Deviation (Sample) | 12.5% | 10.2% |
| Standard Deviation (Population) | 12.3% | 10.1% |
Similar Demographics by Single Mother Poverty
Demographics Similar to Osage by Single Mother Poverty
In terms of single mother poverty, the demographic groups most similar to Osage are U.S. Virgin Islander (32.6%, a difference of 0.11%), Somali (32.6%, a difference of 0.14%), Immigrants from Dominica (32.5%, a difference of 0.37%), Yup'ik (32.5%, a difference of 0.49%), and Immigrants from Latin America (32.4%, a difference of 0.57%).
| Demographics | Rating | Rank | Single Mother Poverty |
| Spanish Americans | 0.0 /100 | #283 | Tragic 32.3% |
| Indonesians | 0.0 /100 | #284 | Tragic 32.4% |
| Immigrants | Latin America | 0.0 /100 | #285 | Tragic 32.4% |
| Yup'ik | 0.0 /100 | #286 | Tragic 32.5% |
| Immigrants | Dominica | 0.0 /100 | #287 | Tragic 32.5% |
| Somalis | 0.0 /100 | #288 | Tragic 32.6% |
| U.S. Virgin Islanders | 0.0 /100 | #289 | Tragic 32.6% |
| Osage | 0.0 /100 | #290 | Tragic 32.6% |
| Guatemalans | 0.0 /100 | #291 | Tragic 32.9% |
| Shoshone | 0.0 /100 | #292 | Tragic 32.9% |
| Aleuts | 0.0 /100 | #293 | Tragic 32.9% |
| French American Indians | 0.0 /100 | #294 | Tragic 33.1% |
| Yaqui | 0.0 /100 | #295 | Tragic 33.1% |
| Blackfeet | 0.0 /100 | #296 | Tragic 33.2% |
| Pennsylvania Germans | 0.0 /100 | #297 | Tragic 33.2% |
Demographics Similar to Immigrants from Greece by Single Mother Poverty
In terms of single mother poverty, the demographic groups most similar to Immigrants from Greece are Immigrants from Vietnam (26.7%, a difference of 0.070%), Sri Lankan (26.7%, a difference of 0.17%), Armenian (26.8%, a difference of 0.23%), Tsimshian (26.8%, a difference of 0.31%), and Immigrants from Sierra Leone (26.9%, a difference of 0.45%).
| Demographics | Rating | Rank | Single Mother Poverty |
| Immigrants | Indonesia | 99.9 /100 | #34 | Exceptional 26.6% |
| Maltese | 99.9 /100 | #35 | Exceptional 26.6% |
| Okinawans | 99.9 /100 | #36 | Exceptional 26.6% |
| Immigrants | Israel | 99.9 /100 | #37 | Exceptional 26.6% |
| Immigrants | Fiji | 99.9 /100 | #38 | Exceptional 26.6% |
| Sri Lankans | 99.9 /100 | #39 | Exceptional 26.7% |
| Immigrants | Vietnam | 99.9 /100 | #40 | Exceptional 26.7% |
| Immigrants | Greece | 99.9 /100 | #41 | Exceptional 26.7% |
| Armenians | 99.9 /100 | #42 | Exceptional 26.8% |
| Tsimshian | 99.9 /100 | #43 | Exceptional 26.8% |
| Immigrants | Sierra Leone | 99.9 /100 | #44 | Exceptional 26.9% |
| Latvians | 99.9 /100 | #45 | Exceptional 26.9% |
| Immigrants | Serbia | 99.9 /100 | #46 | Exceptional 26.9% |
| Egyptians | 99.8 /100 | #47 | Exceptional 26.9% |
| Immigrants | Poland | 99.8 /100 | #48 | Exceptional 26.9% |