Crow vs Immigrants from Eritrea Child Poverty Under the Age of 5
COMPARE
Crow
Immigrants from Eritrea
Child Poverty Under the Age of 5
Child Poverty Under the Age of 5 Comparison
Crow
Immigrants from Eritrea
31.0%
CHILD POVERTY UNDER THE AGE OF 5
0.0/ 100
METRIC RATING
344th/ 347
METRIC RANK
19.1%
CHILD POVERTY UNDER THE AGE OF 5
1.5/ 100
METRIC RATING
226th/ 347
METRIC RANK
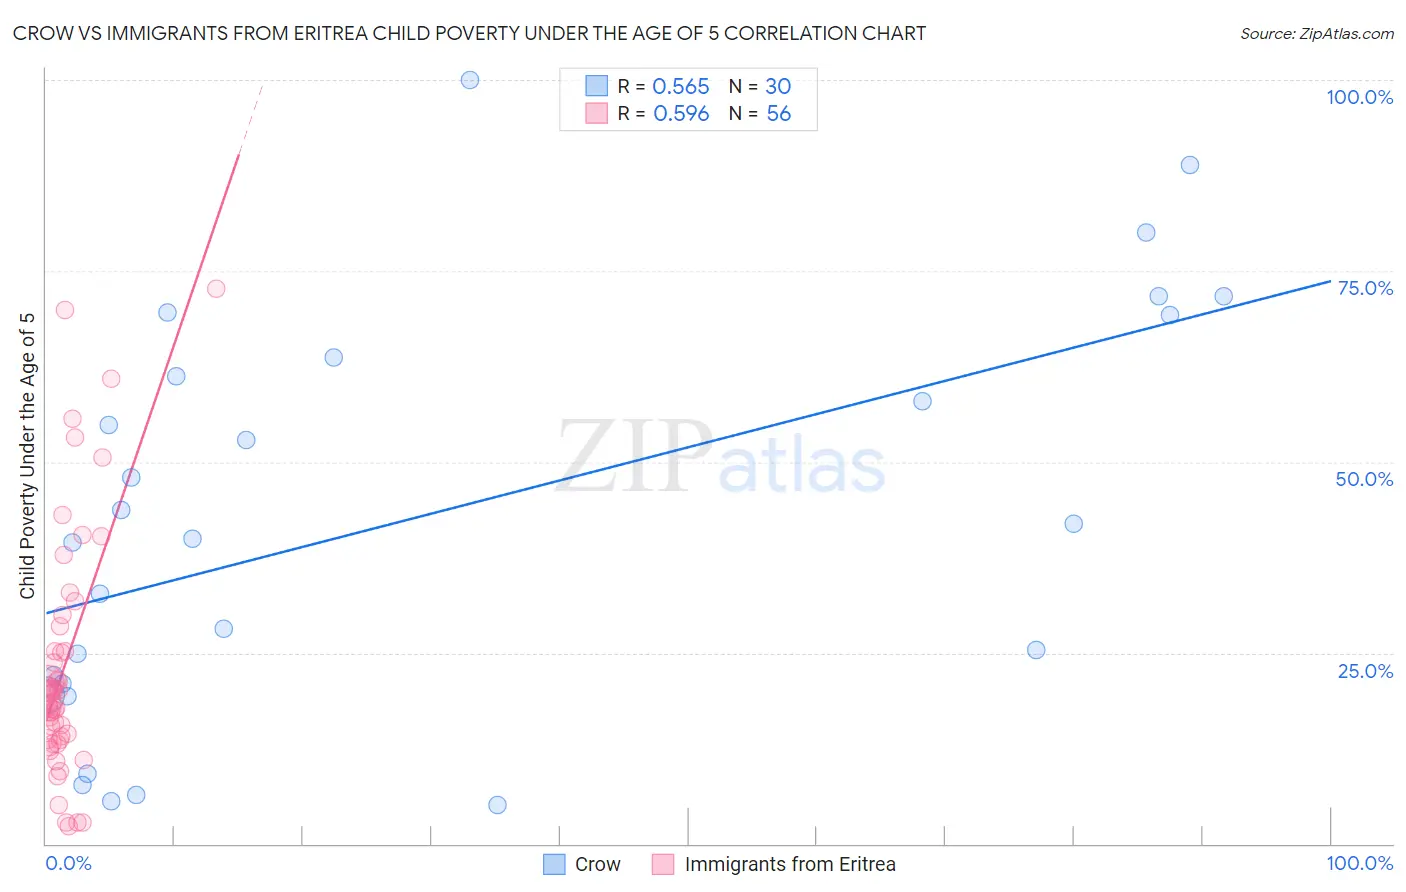
Crow vs Immigrants from Eritrea Child Poverty Under the Age of 5 Correlation Chart
The statistical analysis conducted on geographies consisting of 58,920,729 people shows a substantial positive correlation between the proportion of Crow and poverty level among children under the age of 5 in the United States with a correlation coefficient (R) of 0.565 and weighted average of 31.0%. Similarly, the statistical analysis conducted on geographies consisting of 103,980,872 people shows a substantial positive correlation between the proportion of Immigrants from Eritrea and poverty level among children under the age of 5 in the United States with a correlation coefficient (R) of 0.596 and weighted average of 19.1%, a difference of 62.4%.
Child Poverty Under the Age of 5 Correlation Summary
| Measurement | Crow | Immigrants from Eritrea |
| Minimum | 5.1% | 2.3% |
| Maximum | 100.0% | 72.7% |
| Range | 94.9% | 70.4% |
| Mean | 42.7% | 23.3% |
| Median | 41.0% | 19.0% |
| Interquartile 25% (IQ1) | 20.9% | 13.6% |
| Interquartile 75% (IQ3) | 63.6% | 26.8% |
| Interquartile Range (IQR) | 42.7% | 13.2% |
| Standard Deviation (Sample) | 26.6% | 16.1% |
| Standard Deviation (Population) | 26.2% | 15.9% |
Similar Demographics by Child Poverty Under the Age of 5
Demographics Similar to Crow by Child Poverty Under the Age of 5
In terms of child poverty under the age of 5, the demographic groups most similar to Crow are Navajo (31.6%, a difference of 1.9%), Yuman (29.5%, a difference of 4.9%), Tohono O'odham (29.5%, a difference of 5.1%), Immigrants from Yemen (29.3%, a difference of 5.8%), and Lumbee (33.3%, a difference of 7.4%).
| Demographics | Rating | Rank | Child Poverty Under the Age of 5 |
| Natives/Alaskans | 0.0 /100 | #333 | Tragic 25.6% |
| Blacks/African Americans | 0.0 /100 | #334 | Tragic 25.7% |
| Colville | 0.0 /100 | #335 | Tragic 25.7% |
| Sioux | 0.0 /100 | #336 | Tragic 26.9% |
| Pima | 0.0 /100 | #337 | Tragic 27.4% |
| Hopi | 0.0 /100 | #338 | Tragic 27.7% |
| Yup'ik | 0.0 /100 | #339 | Tragic 27.7% |
| Cheyenne | 0.0 /100 | #340 | Tragic 28.3% |
| Immigrants | Yemen | 0.0 /100 | #341 | Tragic 29.3% |
| Tohono O'odham | 0.0 /100 | #342 | Tragic 29.5% |
| Yuman | 0.0 /100 | #343 | Tragic 29.5% |
| Crow | 0.0 /100 | #344 | Tragic 31.0% |
| Navajo | 0.0 /100 | #345 | Tragic 31.6% |
| Lumbee | 0.0 /100 | #346 | Tragic 33.3% |
| Puerto Ricans | 0.0 /100 | #347 | Tragic 34.5% |
Demographics Similar to Immigrants from Eritrea by Child Poverty Under the Age of 5
In terms of child poverty under the age of 5, the demographic groups most similar to Immigrants from Eritrea are Nigerian (19.1%, a difference of 0.020%), Nicaraguan (19.1%, a difference of 0.050%), Cuban (19.1%, a difference of 0.16%), Alsatian (19.1%, a difference of 0.18%), and Cape Verdean (19.1%, a difference of 0.18%).
| Demographics | Rating | Rank | Child Poverty Under the Age of 5 |
| German Russians | 3.0 /100 | #219 | Tragic 18.8% |
| Immigrants | Azores | 2.6 /100 | #220 | Tragic 18.9% |
| Immigrants | Nigeria | 2.1 /100 | #221 | Tragic 19.0% |
| Alsatians | 1.7 /100 | #222 | Tragic 19.1% |
| Cubans | 1.7 /100 | #223 | Tragic 19.1% |
| Nicaraguans | 1.6 /100 | #224 | Tragic 19.1% |
| Nigerians | 1.6 /100 | #225 | Tragic 19.1% |
| Immigrants | Eritrea | 1.5 /100 | #226 | Tragic 19.1% |
| Cape Verdeans | 1.4 /100 | #227 | Tragic 19.1% |
| Immigrants | Sudan | 1.3 /100 | #228 | Tragic 19.2% |
| Ghanaians | 1.2 /100 | #229 | Tragic 19.2% |
| Ecuadorians | 1.2 /100 | #230 | Tragic 19.2% |
| Bermudans | 1.2 /100 | #231 | Tragic 19.2% |
| Trinidadians and Tobagonians | 0.9 /100 | #232 | Tragic 19.3% |
| Sudanese | 0.9 /100 | #233 | Tragic 19.3% |