Guyanese vs Immigrants from Eritrea Child Poverty Under the Age of 5
COMPARE
Guyanese
Immigrants from Eritrea
Child Poverty Under the Age of 5
Child Poverty Under the Age of 5 Comparison
Guyanese
Immigrants from Eritrea
19.7%
CHILD POVERTY UNDER THE AGE OF 5
0.4/ 100
METRIC RATING
247th/ 347
METRIC RANK
19.1%
CHILD POVERTY UNDER THE AGE OF 5
1.5/ 100
METRIC RATING
226th/ 347
METRIC RANK
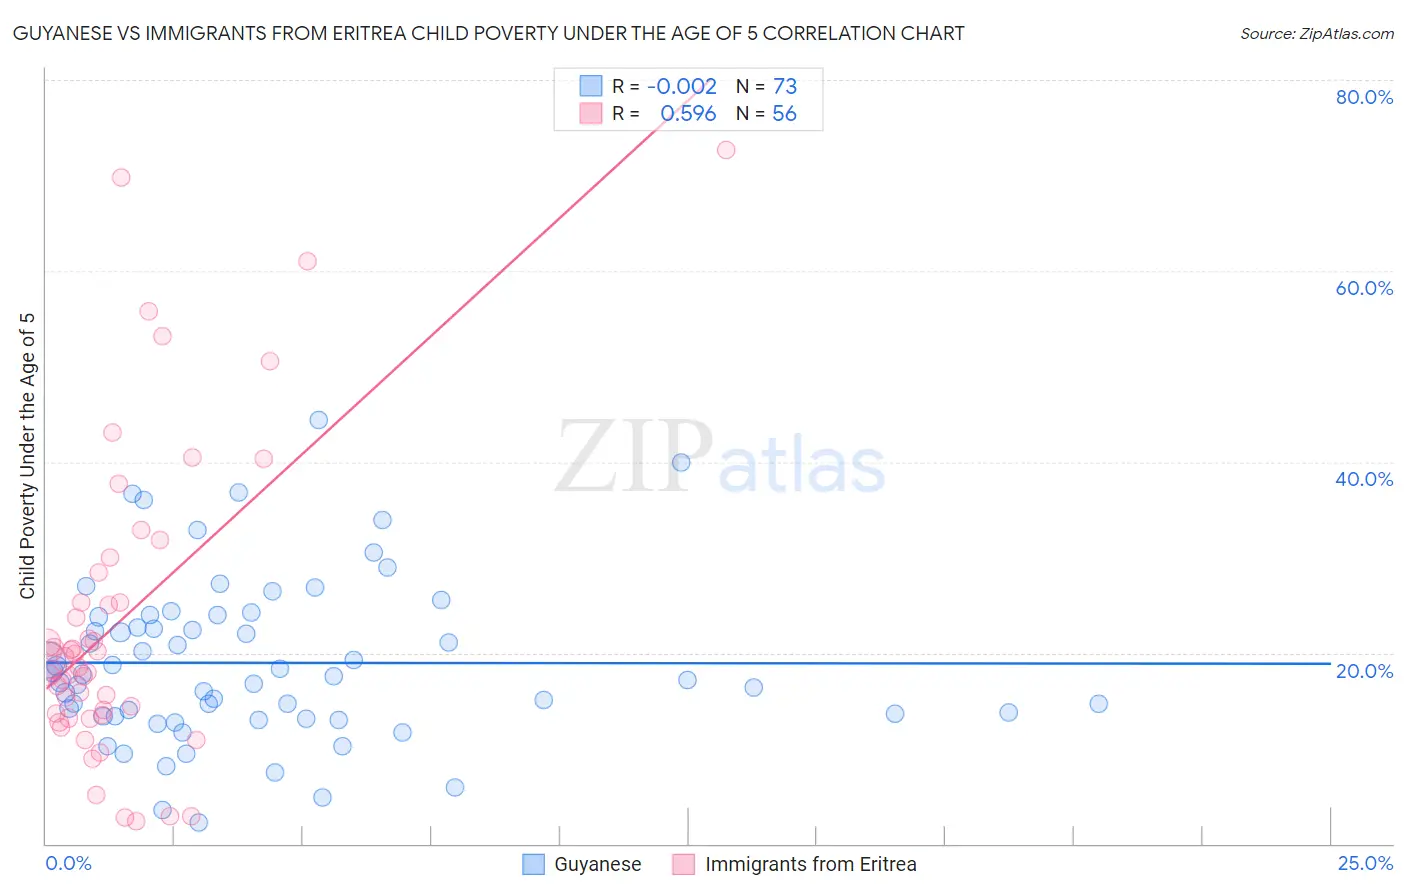
Guyanese vs Immigrants from Eritrea Child Poverty Under the Age of 5 Correlation Chart
The statistical analysis conducted on geographies consisting of 172,709,011 people shows no correlation between the proportion of Guyanese and poverty level among children under the age of 5 in the United States with a correlation coefficient (R) of -0.002 and weighted average of 19.7%. Similarly, the statistical analysis conducted on geographies consisting of 103,980,872 people shows a substantial positive correlation between the proportion of Immigrants from Eritrea and poverty level among children under the age of 5 in the United States with a correlation coefficient (R) of 0.596 and weighted average of 19.1%, a difference of 3.3%.
Child Poverty Under the Age of 5 Correlation Summary
| Measurement | Guyanese | Immigrants from Eritrea |
| Minimum | 2.2% | 2.3% |
| Maximum | 44.4% | 72.7% |
| Range | 42.1% | 70.4% |
| Mean | 18.9% | 23.3% |
| Median | 17.5% | 19.0% |
| Interquartile 25% (IQ1) | 13.4% | 13.6% |
| Interquartile 75% (IQ3) | 23.9% | 26.8% |
| Interquartile Range (IQR) | 10.5% | 13.2% |
| Standard Deviation (Sample) | 8.5% | 16.1% |
| Standard Deviation (Population) | 8.5% | 15.9% |
Similar Demographics by Child Poverty Under the Age of 5
Demographics Similar to Guyanese by Child Poverty Under the Age of 5
In terms of child poverty under the age of 5, the demographic groups most similar to Guyanese are Marshallese (19.7%, a difference of 0.010%), Immigrants from Middle Africa (19.7%, a difference of 0.030%), Nonimmigrants (19.7%, a difference of 0.080%), Cree (19.7%, a difference of 0.16%), and Immigrants from Western Africa (19.7%, a difference of 0.23%).
| Demographics | Rating | Rank | Child Poverty Under the Age of 5 |
| Immigrants | Ecuador | 0.5 /100 | #240 | Tragic 19.6% |
| Alaska Natives | 0.5 /100 | #241 | Tragic 19.6% |
| Immigrants | Guyana | 0.5 /100 | #242 | Tragic 19.6% |
| Osage | 0.5 /100 | #243 | Tragic 19.6% |
| Immigrants | Ghana | 0.5 /100 | #244 | Tragic 19.6% |
| Immigrants | Western Africa | 0.4 /100 | #245 | Tragic 19.7% |
| Cree | 0.4 /100 | #246 | Tragic 19.7% |
| Guyanese | 0.4 /100 | #247 | Tragic 19.7% |
| Marshallese | 0.4 /100 | #248 | Tragic 19.7% |
| Immigrants | Middle Africa | 0.4 /100 | #249 | Tragic 19.7% |
| Immigrants | Nonimmigrants | 0.4 /100 | #250 | Tragic 19.7% |
| Pennsylvania Germans | 0.3 /100 | #251 | Tragic 19.8% |
| Immigrants | Nicaragua | 0.3 /100 | #252 | Tragic 19.8% |
| Mexican American Indians | 0.3 /100 | #253 | Tragic 19.9% |
| Fijians | 0.3 /100 | #254 | Tragic 19.9% |
Demographics Similar to Immigrants from Eritrea by Child Poverty Under the Age of 5
In terms of child poverty under the age of 5, the demographic groups most similar to Immigrants from Eritrea are Nigerian (19.1%, a difference of 0.020%), Nicaraguan (19.1%, a difference of 0.050%), Cuban (19.1%, a difference of 0.16%), Alsatian (19.1%, a difference of 0.18%), and Cape Verdean (19.1%, a difference of 0.18%).
| Demographics | Rating | Rank | Child Poverty Under the Age of 5 |
| German Russians | 3.0 /100 | #219 | Tragic 18.8% |
| Immigrants | Azores | 2.6 /100 | #220 | Tragic 18.9% |
| Immigrants | Nigeria | 2.1 /100 | #221 | Tragic 19.0% |
| Alsatians | 1.7 /100 | #222 | Tragic 19.1% |
| Cubans | 1.7 /100 | #223 | Tragic 19.1% |
| Nicaraguans | 1.6 /100 | #224 | Tragic 19.1% |
| Nigerians | 1.6 /100 | #225 | Tragic 19.1% |
| Immigrants | Eritrea | 1.5 /100 | #226 | Tragic 19.1% |
| Cape Verdeans | 1.4 /100 | #227 | Tragic 19.1% |
| Immigrants | Sudan | 1.3 /100 | #228 | Tragic 19.2% |
| Ghanaians | 1.2 /100 | #229 | Tragic 19.2% |
| Ecuadorians | 1.2 /100 | #230 | Tragic 19.2% |
| Bermudans | 1.2 /100 | #231 | Tragic 19.2% |
| Trinidadians and Tobagonians | 0.9 /100 | #232 | Tragic 19.3% |
| Sudanese | 0.9 /100 | #233 | Tragic 19.3% |