Bolivian vs Immigrants from Micronesia Seniors Poverty Over the Age of 65
COMPARE
Bolivian
Immigrants from Micronesia
Seniors Poverty Over the Age of 65
Seniors Poverty Over the Age of 65 Comparison
Bolivians
Immigrants from Micronesia
9.8%
SENIORS POVERTY OVER THE AGE OF 65
99.1/ 100
METRIC RATING
57th/ 347
METRIC RANK
10.7%
SENIORS POVERTY OVER THE AGE OF 65
70.8/ 100
METRIC RATING
159th/ 347
METRIC RANK
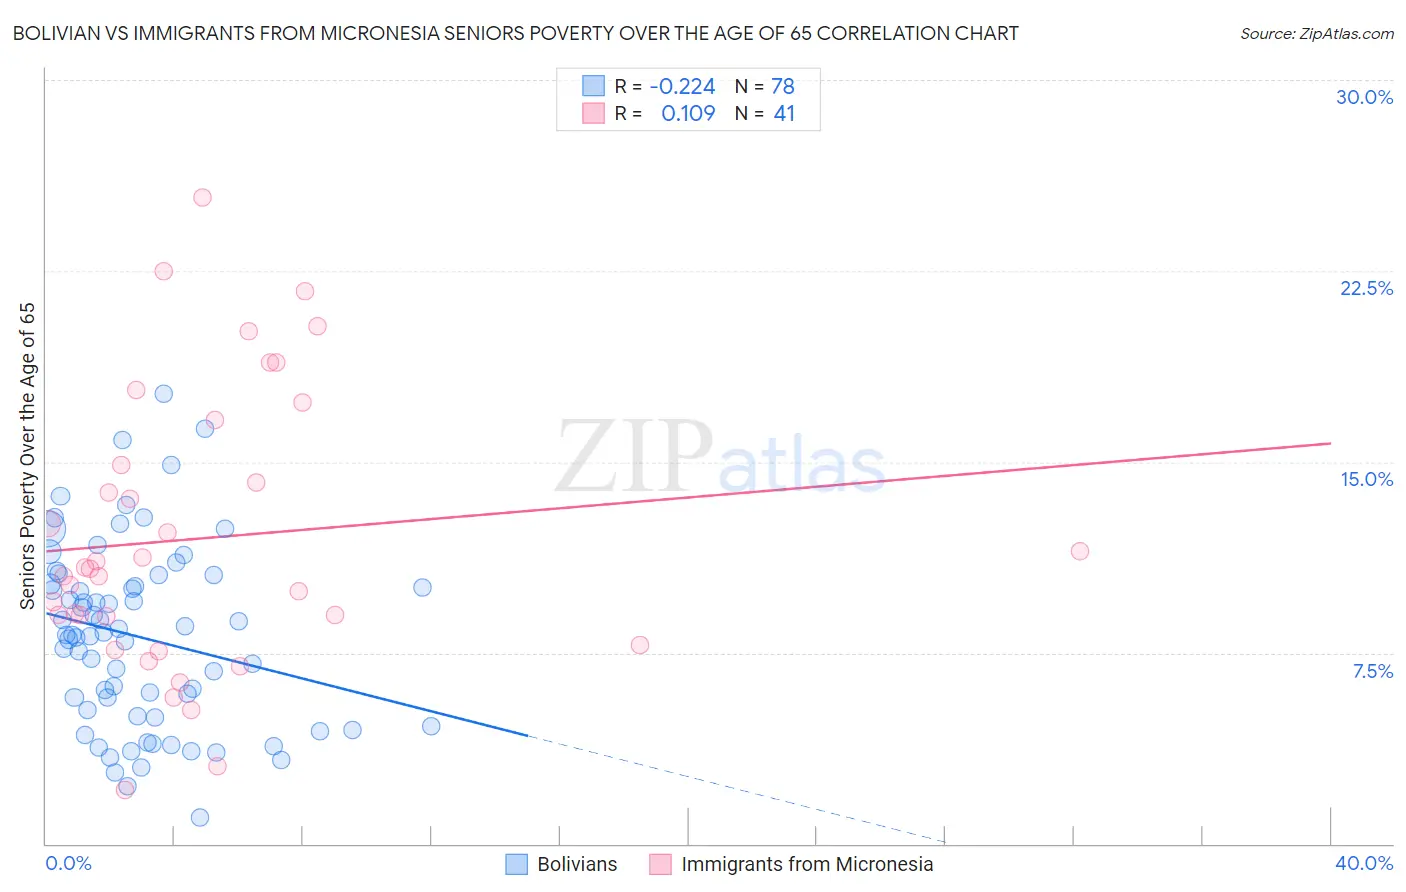
Bolivian vs Immigrants from Micronesia Seniors Poverty Over the Age of 65 Correlation Chart
The statistical analysis conducted on geographies consisting of 184,345,145 people shows a weak negative correlation between the proportion of Bolivians and poverty level among seniors over the age of 65 in the United States with a correlation coefficient (R) of -0.224 and weighted average of 9.8%. Similarly, the statistical analysis conducted on geographies consisting of 61,393,382 people shows a poor positive correlation between the proportion of Immigrants from Micronesia and poverty level among seniors over the age of 65 in the United States with a correlation coefficient (R) of 0.109 and weighted average of 10.7%, a difference of 9.4%.
Seniors Poverty Over the Age of 65 Correlation Summary
| Measurement | Bolivian | Immigrants from Micronesia |
| Minimum | 1.0% | 2.1% |
| Maximum | 17.7% | 25.4% |
| Range | 16.7% | 23.3% |
| Mean | 8.1% | 12.0% |
| Median | 8.2% | 10.8% |
| Interquartile 25% (IQ1) | 5.0% | 8.4% |
| Interquartile 75% (IQ3) | 10.2% | 15.8% |
| Interquartile Range (IQR) | 5.2% | 7.4% |
| Standard Deviation (Sample) | 3.6% | 5.4% |
| Standard Deviation (Population) | 3.5% | 5.4% |
Similar Demographics by Seniors Poverty Over the Age of 65
Demographics Similar to Bolivians by Seniors Poverty Over the Age of 65
In terms of seniors poverty over the age of 65, the demographic groups most similar to Bolivians are Serbian (9.8%, a difference of 0.060%), Immigrants from England (9.8%, a difference of 0.12%), Immigrants from Canada (9.8%, a difference of 0.21%), Afghan (9.8%, a difference of 0.24%), and Celtic (9.8%, a difference of 0.25%).
| Demographics | Rating | Rank | Seniors Poverty Over the Age of 65 |
| Hungarians | 99.4 /100 | #50 | Exceptional 9.7% |
| Carpatho Rusyns | 99.3 /100 | #51 | Exceptional 9.7% |
| Filipinos | 99.3 /100 | #52 | Exceptional 9.7% |
| Slavs | 99.2 /100 | #53 | Exceptional 9.8% |
| Immigrants | Northern Europe | 99.2 /100 | #54 | Exceptional 9.8% |
| Afghans | 99.2 /100 | #55 | Exceptional 9.8% |
| Immigrants | England | 99.1 /100 | #56 | Exceptional 9.8% |
| Bolivians | 99.1 /100 | #57 | Exceptional 9.8% |
| Serbians | 99.1 /100 | #58 | Exceptional 9.8% |
| Immigrants | Canada | 99.0 /100 | #59 | Exceptional 9.8% |
| Celtics | 99.0 /100 | #60 | Exceptional 9.8% |
| Iranians | 98.9 /100 | #61 | Exceptional 9.8% |
| French Canadians | 98.9 /100 | #62 | Exceptional 9.8% |
| Macedonians | 98.8 /100 | #63 | Exceptional 9.9% |
| Immigrants | North America | 98.8 /100 | #64 | Exceptional 9.9% |
Demographics Similar to Immigrants from Micronesia by Seniors Poverty Over the Age of 65
In terms of seniors poverty over the age of 65, the demographic groups most similar to Immigrants from Micronesia are Immigrants from Sierra Leone (10.7%, a difference of 0.10%), Ethiopian (10.7%, a difference of 0.24%), Immigrants from Ethiopia (10.7%, a difference of 0.24%), Sudanese (10.7%, a difference of 0.27%), and Chickasaw (10.7%, a difference of 0.32%).
| Demographics | Rating | Rank | Seniors Poverty Over the Age of 65 |
| Immigrants | Egypt | 76.5 /100 | #152 | Good 10.6% |
| Fijians | 75.6 /100 | #153 | Good 10.7% |
| Immigrants | Saudi Arabia | 74.9 /100 | #154 | Good 10.7% |
| Chickasaw | 73.6 /100 | #155 | Good 10.7% |
| Ethiopians | 72.9 /100 | #156 | Good 10.7% |
| Immigrants | Ethiopia | 72.9 /100 | #157 | Good 10.7% |
| Immigrants | Sierra Leone | 71.7 /100 | #158 | Good 10.7% |
| Immigrants | Micronesia | 70.8 /100 | #159 | Good 10.7% |
| Sudanese | 68.2 /100 | #160 | Good 10.7% |
| Arabs | 65.2 /100 | #161 | Good 10.8% |
| Immigrants | Indonesia | 64.8 /100 | #162 | Good 10.8% |
| Tsimshian | 64.5 /100 | #163 | Good 10.8% |
| Potawatomi | 62.6 /100 | #164 | Good 10.8% |
| Immigrants | South Eastern Asia | 62.1 /100 | #165 | Good 10.8% |
| Malaysians | 62.0 /100 | #166 | Good 10.8% |