Bolivian vs Guyanese Seniors Poverty Over the Age of 65
COMPARE
Bolivian
Guyanese
Seniors Poverty Over the Age of 65
Seniors Poverty Over the Age of 65 Comparison
Bolivians
Guyanese
9.8%
SENIORS POVERTY OVER THE AGE OF 65
99.1/ 100
METRIC RATING
57th/ 347
METRIC RANK
14.4%
SENIORS POVERTY OVER THE AGE OF 65
0.0/ 100
METRIC RATING
314th/ 347
METRIC RANK
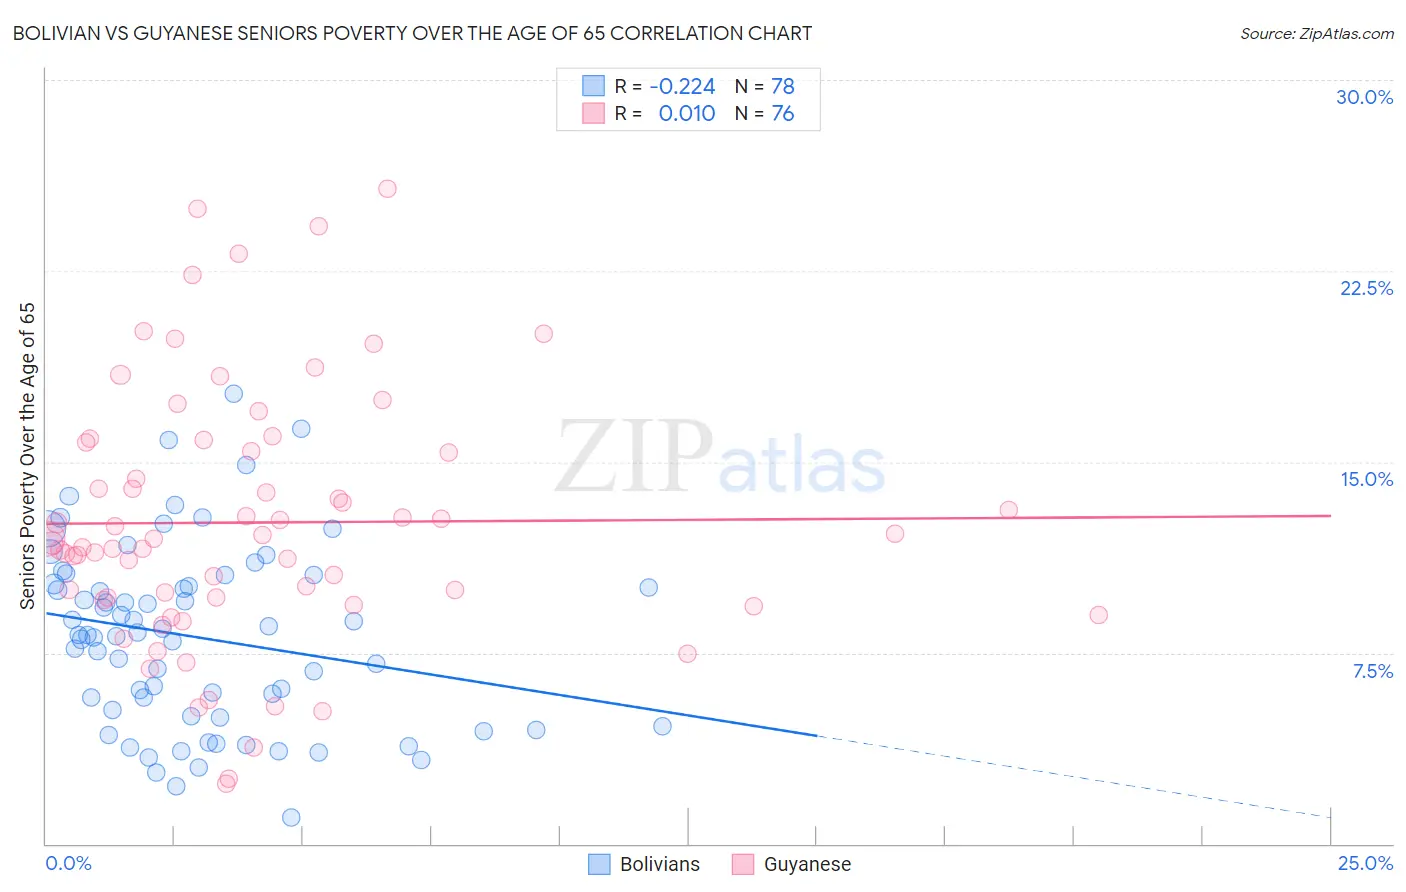
Bolivian vs Guyanese Seniors Poverty Over the Age of 65 Correlation Chart
The statistical analysis conducted on geographies consisting of 184,345,145 people shows a weak negative correlation between the proportion of Bolivians and poverty level among seniors over the age of 65 in the United States with a correlation coefficient (R) of -0.224 and weighted average of 9.8%. Similarly, the statistical analysis conducted on geographies consisting of 176,439,403 people shows no correlation between the proportion of Guyanese and poverty level among seniors over the age of 65 in the United States with a correlation coefficient (R) of 0.010 and weighted average of 14.4%, a difference of 47.2%.
Seniors Poverty Over the Age of 65 Correlation Summary
| Measurement | Bolivian | Guyanese |
| Minimum | 1.0% | 2.4% |
| Maximum | 17.7% | 25.7% |
| Range | 16.7% | 23.3% |
| Mean | 8.1% | 12.6% |
| Median | 8.2% | 11.9% |
| Interquartile 25% (IQ1) | 5.0% | 9.6% |
| Interquartile 75% (IQ3) | 10.2% | 15.6% |
| Interquartile Range (IQR) | 5.2% | 6.0% |
| Standard Deviation (Sample) | 3.6% | 5.0% |
| Standard Deviation (Population) | 3.5% | 5.0% |
Similar Demographics by Seniors Poverty Over the Age of 65
Demographics Similar to Bolivians by Seniors Poverty Over the Age of 65
In terms of seniors poverty over the age of 65, the demographic groups most similar to Bolivians are Serbian (9.8%, a difference of 0.060%), Immigrants from England (9.8%, a difference of 0.12%), Immigrants from Canada (9.8%, a difference of 0.21%), Afghan (9.8%, a difference of 0.24%), and Celtic (9.8%, a difference of 0.25%).
| Demographics | Rating | Rank | Seniors Poverty Over the Age of 65 |
| Hungarians | 99.4 /100 | #50 | Exceptional 9.7% |
| Carpatho Rusyns | 99.3 /100 | #51 | Exceptional 9.7% |
| Filipinos | 99.3 /100 | #52 | Exceptional 9.7% |
| Slavs | 99.2 /100 | #53 | Exceptional 9.8% |
| Immigrants | Northern Europe | 99.2 /100 | #54 | Exceptional 9.8% |
| Afghans | 99.2 /100 | #55 | Exceptional 9.8% |
| Immigrants | England | 99.1 /100 | #56 | Exceptional 9.8% |
| Bolivians | 99.1 /100 | #57 | Exceptional 9.8% |
| Serbians | 99.1 /100 | #58 | Exceptional 9.8% |
| Immigrants | Canada | 99.0 /100 | #59 | Exceptional 9.8% |
| Celtics | 99.0 /100 | #60 | Exceptional 9.8% |
| Iranians | 98.9 /100 | #61 | Exceptional 9.8% |
| French Canadians | 98.9 /100 | #62 | Exceptional 9.8% |
| Macedonians | 98.8 /100 | #63 | Exceptional 9.9% |
| Immigrants | North America | 98.8 /100 | #64 | Exceptional 9.9% |
Demographics Similar to Guyanese by Seniors Poverty Over the Age of 65
In terms of seniors poverty over the age of 65, the demographic groups most similar to Guyanese are Immigrants from Ecuador (14.4%, a difference of 0.030%), Immigrants from Guyana (14.5%, a difference of 0.24%), Haitian (14.5%, a difference of 0.27%), Barbadian (14.4%, a difference of 0.39%), and Immigrants from Honduras (14.5%, a difference of 0.49%).
| Demographics | Rating | Rank | Seniors Poverty Over the Age of 65 |
| Immigrants | West Indies | 0.0 /100 | #307 | Tragic 14.2% |
| Trinidadians and Tobagonians | 0.0 /100 | #308 | Tragic 14.2% |
| Hondurans | 0.0 /100 | #309 | Tragic 14.2% |
| Bahamians | 0.0 /100 | #310 | Tragic 14.2% |
| Natives/Alaskans | 0.0 /100 | #311 | Tragic 14.2% |
| Hispanics or Latinos | 0.0 /100 | #312 | Tragic 14.3% |
| Barbadians | 0.0 /100 | #313 | Tragic 14.4% |
| Guyanese | 0.0 /100 | #314 | Tragic 14.4% |
| Immigrants | Ecuador | 0.0 /100 | #315 | Tragic 14.4% |
| Immigrants | Guyana | 0.0 /100 | #316 | Tragic 14.5% |
| Haitians | 0.0 /100 | #317 | Tragic 14.5% |
| Immigrants | Honduras | 0.0 /100 | #318 | Tragic 14.5% |
| Cape Verdeans | 0.0 /100 | #319 | Tragic 14.7% |
| Immigrants | Haiti | 0.0 /100 | #320 | Tragic 14.7% |
| Houma | 0.0 /100 | #321 | Tragic 14.7% |