Bolivian vs Immigrants from Morocco Seniors Poverty Over the Age of 65
COMPARE
Bolivian
Immigrants from Morocco
Seniors Poverty Over the Age of 65
Seniors Poverty Over the Age of 65 Comparison
Bolivians
Immigrants from Morocco
9.8%
SENIORS POVERTY OVER THE AGE OF 65
99.1/ 100
METRIC RATING
57th/ 347
METRIC RANK
11.6%
SENIORS POVERTY OVER THE AGE OF 65
6.8/ 100
METRIC RATING
216th/ 347
METRIC RANK
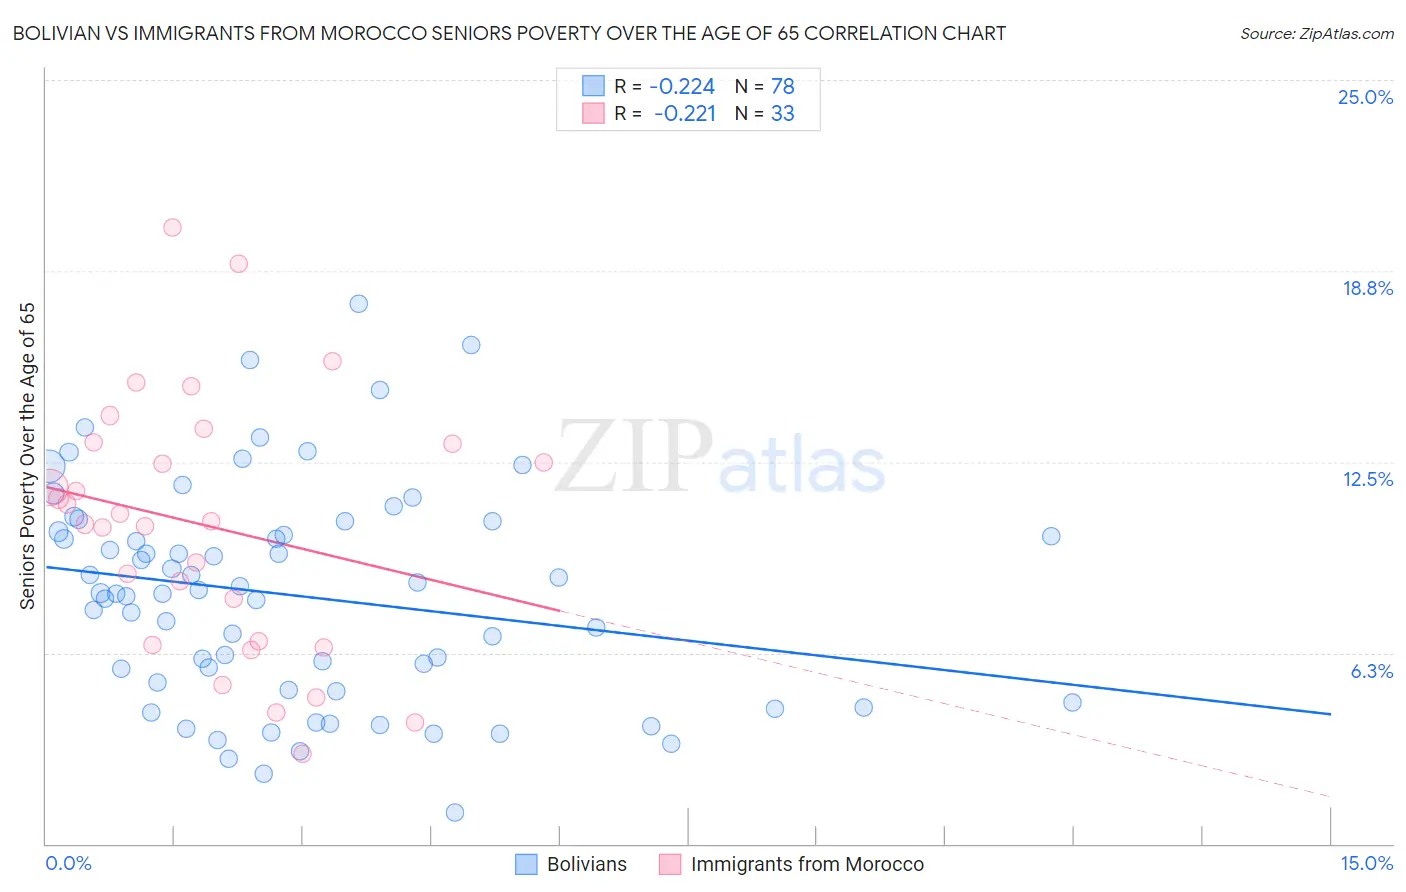
Bolivian vs Immigrants from Morocco Seniors Poverty Over the Age of 65 Correlation Chart
The statistical analysis conducted on geographies consisting of 184,345,145 people shows a weak negative correlation between the proportion of Bolivians and poverty level among seniors over the age of 65 in the United States with a correlation coefficient (R) of -0.224 and weighted average of 9.8%. Similarly, the statistical analysis conducted on geographies consisting of 178,796,340 people shows a weak negative correlation between the proportion of Immigrants from Morocco and poverty level among seniors over the age of 65 in the United States with a correlation coefficient (R) of -0.221 and weighted average of 11.6%, a difference of 18.1%.
Seniors Poverty Over the Age of 65 Correlation Summary
| Measurement | Bolivian | Immigrants from Morocco |
| Minimum | 1.0% | 2.9% |
| Maximum | 17.7% | 20.2% |
| Range | 16.7% | 17.2% |
| Mean | 8.1% | 10.4% |
| Median | 8.2% | 10.6% |
| Interquartile 25% (IQ1) | 5.0% | 6.6% |
| Interquartile 75% (IQ3) | 10.2% | 13.1% |
| Interquartile Range (IQR) | 5.2% | 6.6% |
| Standard Deviation (Sample) | 3.6% | 4.2% |
| Standard Deviation (Population) | 3.5% | 4.1% |
Similar Demographics by Seniors Poverty Over the Age of 65
Demographics Similar to Bolivians by Seniors Poverty Over the Age of 65
In terms of seniors poverty over the age of 65, the demographic groups most similar to Bolivians are Serbian (9.8%, a difference of 0.060%), Immigrants from England (9.8%, a difference of 0.12%), Immigrants from Canada (9.8%, a difference of 0.21%), Afghan (9.8%, a difference of 0.24%), and Celtic (9.8%, a difference of 0.25%).
| Demographics | Rating | Rank | Seniors Poverty Over the Age of 65 |
| Hungarians | 99.4 /100 | #50 | Exceptional 9.7% |
| Carpatho Rusyns | 99.3 /100 | #51 | Exceptional 9.7% |
| Filipinos | 99.3 /100 | #52 | Exceptional 9.7% |
| Slavs | 99.2 /100 | #53 | Exceptional 9.8% |
| Immigrants | Northern Europe | 99.2 /100 | #54 | Exceptional 9.8% |
| Afghans | 99.2 /100 | #55 | Exceptional 9.8% |
| Immigrants | England | 99.1 /100 | #56 | Exceptional 9.8% |
| Bolivians | 99.1 /100 | #57 | Exceptional 9.8% |
| Serbians | 99.1 /100 | #58 | Exceptional 9.8% |
| Immigrants | Canada | 99.0 /100 | #59 | Exceptional 9.8% |
| Celtics | 99.0 /100 | #60 | Exceptional 9.8% |
| Iranians | 98.9 /100 | #61 | Exceptional 9.8% |
| French Canadians | 98.9 /100 | #62 | Exceptional 9.8% |
| Macedonians | 98.8 /100 | #63 | Exceptional 9.9% |
| Immigrants | North America | 98.8 /100 | #64 | Exceptional 9.9% |
Demographics Similar to Immigrants from Morocco by Seniors Poverty Over the Age of 65
In terms of seniors poverty over the age of 65, the demographic groups most similar to Immigrants from Morocco are Immigrants from Africa (11.6%, a difference of 0.15%), Immigrants from Ukraine (11.6%, a difference of 0.41%), French American Indian (11.5%, a difference of 0.55%), Immigrants from Russia (11.5%, a difference of 0.59%), and Arapaho (11.6%, a difference of 0.59%).
| Demographics | Rating | Rank | Seniors Poverty Over the Age of 65 |
| Paraguayans | 11.3 /100 | #209 | Poor 11.4% |
| Ugandans | 11.2 /100 | #210 | Poor 11.4% |
| Indonesians | 10.4 /100 | #211 | Poor 11.5% |
| Immigrants | China | 9.5 /100 | #212 | Tragic 11.5% |
| Nepalese | 8.9 /100 | #213 | Tragic 11.5% |
| Immigrants | Russia | 8.8 /100 | #214 | Tragic 11.5% |
| French American Indians | 8.7 /100 | #215 | Tragic 11.5% |
| Immigrants | Morocco | 6.8 /100 | #216 | Tragic 11.6% |
| Immigrants | Africa | 6.4 /100 | #217 | Tragic 11.6% |
| Immigrants | Ukraine | 5.7 /100 | #218 | Tragic 11.6% |
| Arapaho | 5.2 /100 | #219 | Tragic 11.6% |
| Peruvians | 4.2 /100 | #220 | Tragic 11.7% |
| Argentineans | 4.1 /100 | #221 | Tragic 11.7% |
| Immigrants | Chile | 3.9 /100 | #222 | Tragic 11.7% |
| Immigrants | Congo | 3.8 /100 | #223 | Tragic 11.7% |