Black/African American vs Portuguese Receiving Food Stamps
COMPARE
Black/African American
Portuguese
Receiving Food Stamps
Receiving Food Stamps Comparison
Blacks/African Americans
Portuguese
17.2%
RECEIVING FOOD STAMPS
0.0/ 100
METRIC RATING
317th/ 347
METRIC RANK
12.2%
RECEIVING FOOD STAMPS
25.1/ 100
METRIC RATING
199th/ 347
METRIC RANK
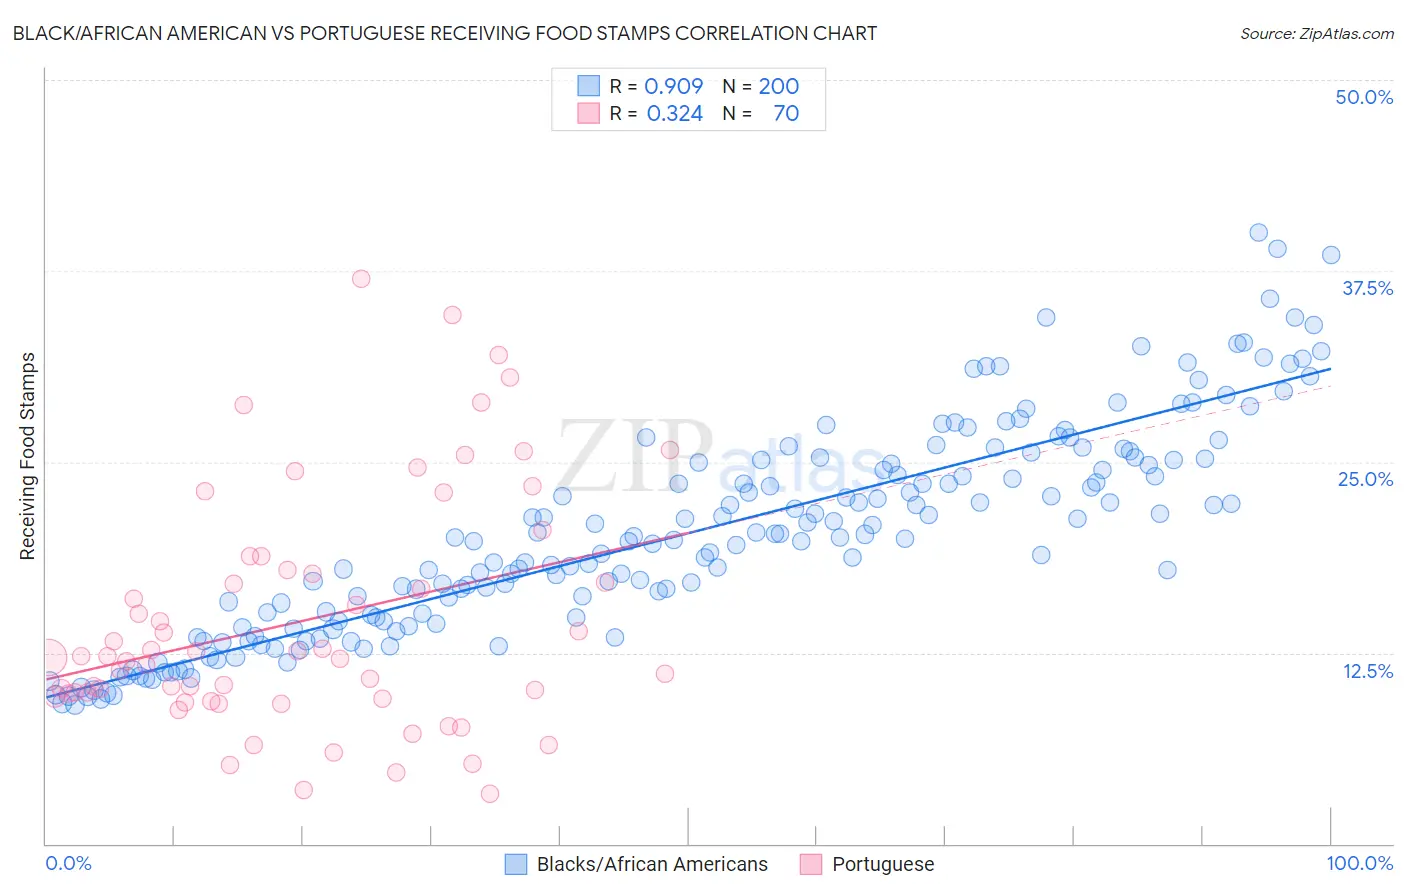
Black/African American vs Portuguese Receiving Food Stamps Correlation Chart
The statistical analysis conducted on geographies consisting of 562,963,519 people shows a near-perfect positive correlation between the proportion of Blacks/African Americans and percentage of population receiving government assistance and/or food stamps in the United States with a correlation coefficient (R) of 0.909 and weighted average of 17.2%. Similarly, the statistical analysis conducted on geographies consisting of 448,612,640 people shows a mild positive correlation between the proportion of Portuguese and percentage of population receiving government assistance and/or food stamps in the United States with a correlation coefficient (R) of 0.324 and weighted average of 12.2%, a difference of 40.9%.
Receiving Food Stamps Correlation Summary
| Measurement | Black/African American | Portuguese |
| Minimum | 9.1% | 3.3% |
| Maximum | 40.0% | 37.0% |
| Range | 31.0% | 33.7% |
| Mean | 20.3% | 14.6% |
| Median | 20.0% | 12.2% |
| Interquartile 25% (IQ1) | 14.7% | 9.6% |
| Interquartile 75% (IQ3) | 25.0% | 17.9% |
| Interquartile Range (IQR) | 10.3% | 8.3% |
| Standard Deviation (Sample) | 6.8% | 7.7% |
| Standard Deviation (Population) | 6.8% | 7.7% |
Similar Demographics by Receiving Food Stamps
Demographics Similar to Blacks/African Americans by Receiving Food Stamps
In terms of receiving food stamps, the demographic groups most similar to Blacks/African Americans are Menominee (17.2%, a difference of 0.17%), Immigrants from St. Vincent and the Grenadines (17.2%, a difference of 0.35%), Immigrants from Nicaragua (17.2%, a difference of 0.43%), Central American Indian (17.1%, a difference of 0.53%), and Native/Alaskan (17.3%, a difference of 0.62%).
| Demographics | Rating | Rank | Receiving Food Stamps |
| Immigrants | Barbados | 0.0 /100 | #310 | Tragic 16.6% |
| Guyanese | 0.0 /100 | #311 | Tragic 16.7% |
| Sioux | 0.0 /100 | #312 | Tragic 16.8% |
| Immigrants | Jamaica | 0.0 /100 | #313 | Tragic 16.9% |
| Immigrants | Guyana | 0.0 /100 | #314 | Tragic 16.9% |
| Bahamians | 0.0 /100 | #315 | Tragic 17.0% |
| Central American Indians | 0.0 /100 | #316 | Tragic 17.1% |
| Blacks/African Americans | 0.0 /100 | #317 | Tragic 17.2% |
| Menominee | 0.0 /100 | #318 | Tragic 17.2% |
| Immigrants | St. Vincent and the Grenadines | 0.0 /100 | #319 | Tragic 17.2% |
| Immigrants | Nicaragua | 0.0 /100 | #320 | Tragic 17.2% |
| Natives/Alaskans | 0.0 /100 | #321 | Tragic 17.3% |
| Immigrants | Grenada | 0.0 /100 | #322 | Tragic 17.8% |
| Haitians | 0.0 /100 | #323 | Tragic 17.8% |
| British West Indians | 0.0 /100 | #324 | Tragic 17.9% |
Demographics Similar to Portuguese by Receiving Food Stamps
In terms of receiving food stamps, the demographic groups most similar to Portuguese are Immigrants from Costa Rica (12.2%, a difference of 0.050%), Delaware (12.2%, a difference of 0.18%), Iraqi (12.2%, a difference of 0.26%), Sierra Leonean (12.2%, a difference of 0.28%), and American (12.2%, a difference of 0.29%).
| Demographics | Rating | Rank | Receiving Food Stamps |
| Samoans | 31.0 /100 | #192 | Fair 12.1% |
| Immigrants | Fiji | 27.8 /100 | #193 | Fair 12.1% |
| Immigrants | Sudan | 27.1 /100 | #194 | Fair 12.1% |
| Americans | 26.7 /100 | #195 | Fair 12.2% |
| Iraqis | 26.6 /100 | #196 | Fair 12.2% |
| Delaware | 26.1 /100 | #197 | Fair 12.2% |
| Immigrants | Costa Rica | 25.4 /100 | #198 | Fair 12.2% |
| Portuguese | 25.1 /100 | #199 | Fair 12.2% |
| Sierra Leoneans | 23.6 /100 | #200 | Fair 12.2% |
| Ugandans | 22.5 /100 | #201 | Fair 12.2% |
| Immigrants | Venezuela | 20.1 /100 | #202 | Fair 12.3% |
| Shoshone | 17.7 /100 | #203 | Poor 12.4% |
| Immigrants | Nonimmigrants | 17.6 /100 | #204 | Poor 12.4% |
| Aleuts | 17.3 /100 | #205 | Poor 12.4% |
| Immigrants | Thailand | 17.0 /100 | #206 | Poor 12.4% |