Black/African American vs Immigrants from South Africa Receiving Food Stamps
COMPARE
Black/African American
Immigrants from South Africa
Receiving Food Stamps
Receiving Food Stamps Comparison
Blacks/African Americans
Immigrants from South Africa
17.2%
RECEIVING FOOD STAMPS
0.0/ 100
METRIC RATING
317th/ 347
METRIC RANK
9.7%
RECEIVING FOOD STAMPS
99.3/ 100
METRIC RATING
52nd/ 347
METRIC RANK
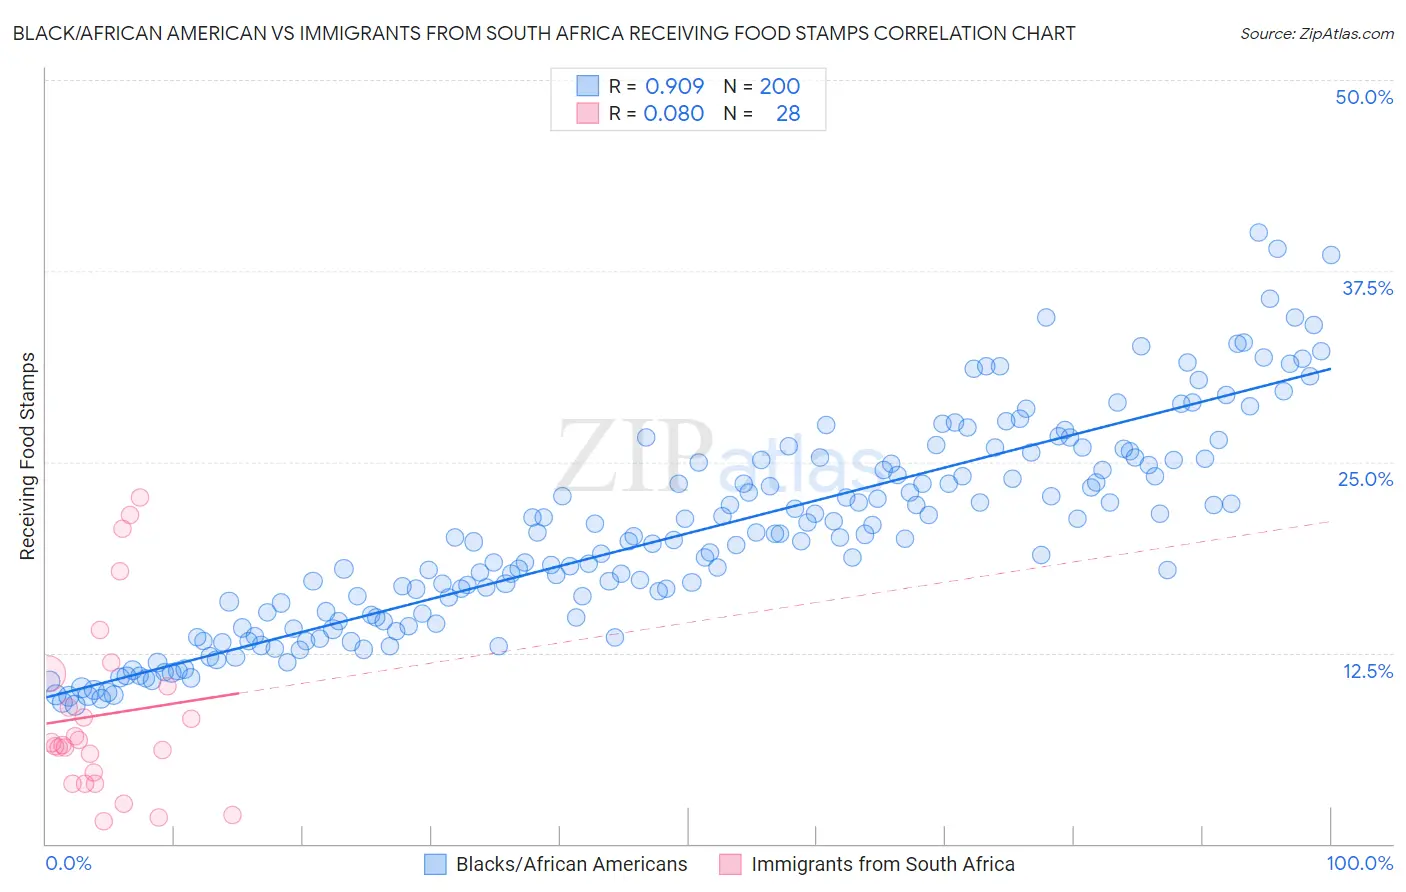
Black/African American vs Immigrants from South Africa Receiving Food Stamps Correlation Chart
The statistical analysis conducted on geographies consisting of 562,963,519 people shows a near-perfect positive correlation between the proportion of Blacks/African Americans and percentage of population receiving government assistance and/or food stamps in the United States with a correlation coefficient (R) of 0.909 and weighted average of 17.2%. Similarly, the statistical analysis conducted on geographies consisting of 232,853,453 people shows a slight positive correlation between the proportion of Immigrants from South Africa and percentage of population receiving government assistance and/or food stamps in the United States with a correlation coefficient (R) of 0.080 and weighted average of 9.7%, a difference of 77.3%.
Receiving Food Stamps Correlation Summary
| Measurement | Black/African American | Immigrants from South Africa |
| Minimum | 9.1% | 1.5% |
| Maximum | 40.0% | 22.6% |
| Range | 31.0% | 21.1% |
| Mean | 20.3% | 8.5% |
| Median | 20.0% | 6.5% |
| Interquartile 25% (IQ1) | 14.7% | 4.3% |
| Interquartile 75% (IQ3) | 25.0% | 10.7% |
| Interquartile Range (IQR) | 10.3% | 6.4% |
| Standard Deviation (Sample) | 6.8% | 5.9% |
| Standard Deviation (Population) | 6.8% | 5.8% |
Similar Demographics by Receiving Food Stamps
Demographics Similar to Blacks/African Americans by Receiving Food Stamps
In terms of receiving food stamps, the demographic groups most similar to Blacks/African Americans are Menominee (17.2%, a difference of 0.17%), Immigrants from St. Vincent and the Grenadines (17.2%, a difference of 0.35%), Immigrants from Nicaragua (17.2%, a difference of 0.43%), Central American Indian (17.1%, a difference of 0.53%), and Native/Alaskan (17.3%, a difference of 0.62%).
| Demographics | Rating | Rank | Receiving Food Stamps |
| Immigrants | Barbados | 0.0 /100 | #310 | Tragic 16.6% |
| Guyanese | 0.0 /100 | #311 | Tragic 16.7% |
| Sioux | 0.0 /100 | #312 | Tragic 16.8% |
| Immigrants | Jamaica | 0.0 /100 | #313 | Tragic 16.9% |
| Immigrants | Guyana | 0.0 /100 | #314 | Tragic 16.9% |
| Bahamians | 0.0 /100 | #315 | Tragic 17.0% |
| Central American Indians | 0.0 /100 | #316 | Tragic 17.1% |
| Blacks/African Americans | 0.0 /100 | #317 | Tragic 17.2% |
| Menominee | 0.0 /100 | #318 | Tragic 17.2% |
| Immigrants | St. Vincent and the Grenadines | 0.0 /100 | #319 | Tragic 17.2% |
| Immigrants | Nicaragua | 0.0 /100 | #320 | Tragic 17.2% |
| Natives/Alaskans | 0.0 /100 | #321 | Tragic 17.3% |
| Immigrants | Grenada | 0.0 /100 | #322 | Tragic 17.8% |
| Haitians | 0.0 /100 | #323 | Tragic 17.8% |
| British West Indians | 0.0 /100 | #324 | Tragic 17.9% |
Demographics Similar to Immigrants from South Africa by Receiving Food Stamps
In terms of receiving food stamps, the demographic groups most similar to Immigrants from South Africa are Asian (9.7%, a difference of 0.010%), Tongan (9.7%, a difference of 0.010%), Swiss (9.7%, a difference of 0.13%), Immigrants from Switzerland (9.7%, a difference of 0.14%), and Lithuanian (9.7%, a difference of 0.19%).
| Demographics | Rating | Rank | Receiving Food Stamps |
| Immigrants | Belgium | 99.4 /100 | #45 | Exceptional 9.6% |
| Australians | 99.4 /100 | #46 | Exceptional 9.6% |
| Indians (Asian) | 99.4 /100 | #47 | Exceptional 9.6% |
| Russians | 99.4 /100 | #48 | Exceptional 9.6% |
| Immigrants | Czechoslovakia | 99.4 /100 | #49 | Exceptional 9.6% |
| Lithuanians | 99.4 /100 | #50 | Exceptional 9.7% |
| Asians | 99.3 /100 | #51 | Exceptional 9.7% |
| Immigrants | South Africa | 99.3 /100 | #52 | Exceptional 9.7% |
| Tongans | 99.3 /100 | #53 | Exceptional 9.7% |
| Swiss | 99.3 /100 | #54 | Exceptional 9.7% |
| Immigrants | Switzerland | 99.3 /100 | #55 | Exceptional 9.7% |
| Immigrants | Canada | 99.3 /100 | #56 | Exceptional 9.7% |
| Greeks | 99.3 /100 | #57 | Exceptional 9.7% |
| Scandinavians | 99.2 /100 | #58 | Exceptional 9.7% |
| British | 99.2 /100 | #59 | Exceptional 9.7% |