Black/African American vs Immigrants from North America Receiving Food Stamps
COMPARE
Black/African American
Immigrants from North America
Receiving Food Stamps
Receiving Food Stamps Comparison
Blacks/African Americans
Immigrants from North America
17.2%
RECEIVING FOOD STAMPS
0.0/ 100
METRIC RATING
317th/ 347
METRIC RANK
9.8%
RECEIVING FOOD STAMPS
99.2/ 100
METRIC RATING
64th/ 347
METRIC RANK
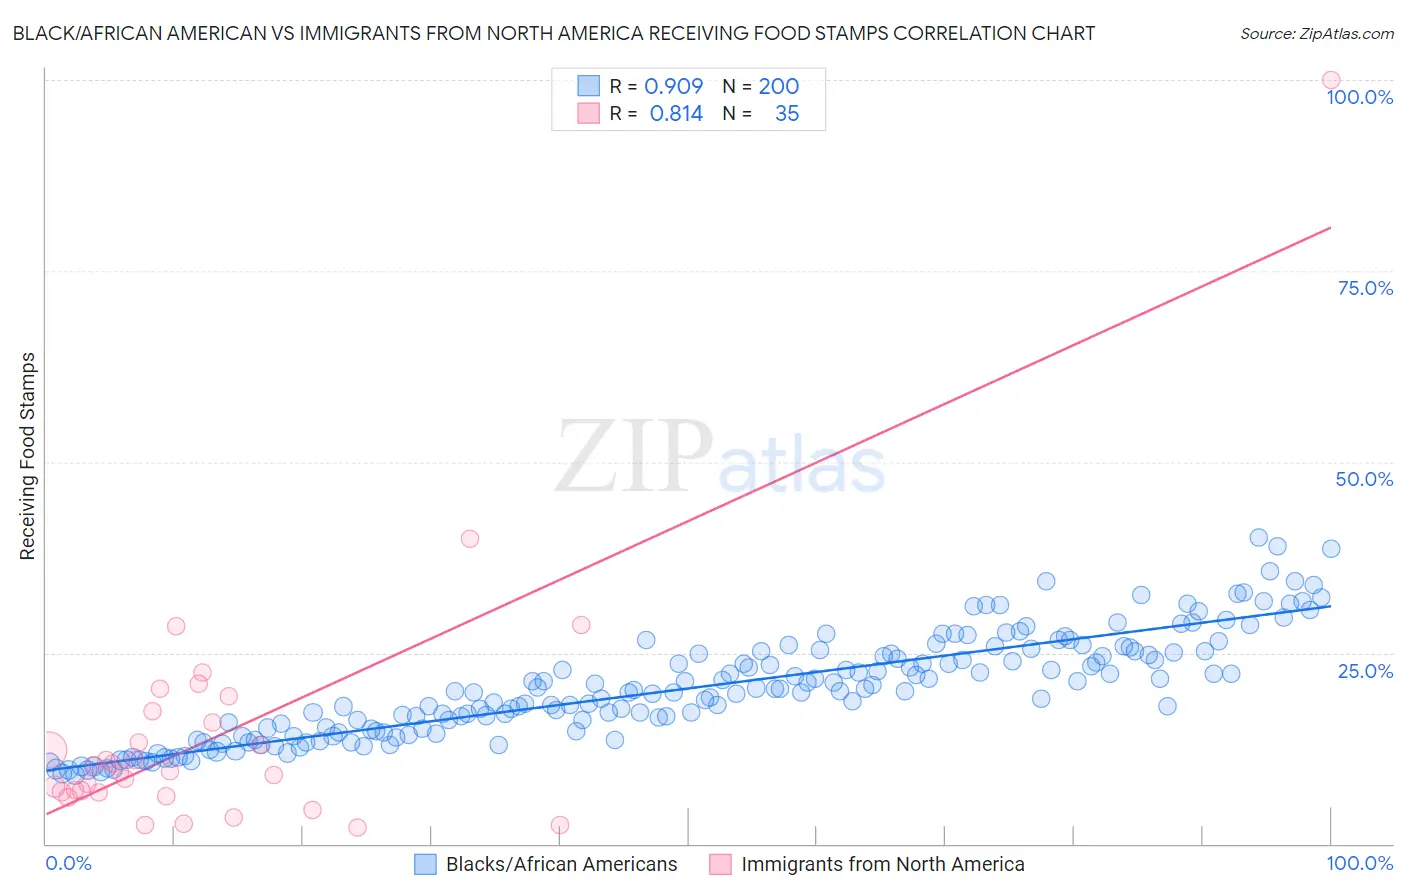
Black/African American vs Immigrants from North America Receiving Food Stamps Correlation Chart
The statistical analysis conducted on geographies consisting of 562,963,519 people shows a near-perfect positive correlation between the proportion of Blacks/African Americans and percentage of population receiving government assistance and/or food stamps in the United States with a correlation coefficient (R) of 0.909 and weighted average of 17.2%. Similarly, the statistical analysis conducted on geographies consisting of 460,673,345 people shows a very strong positive correlation between the proportion of Immigrants from North America and percentage of population receiving government assistance and/or food stamps in the United States with a correlation coefficient (R) of 0.814 and weighted average of 9.8%, a difference of 75.6%.
Receiving Food Stamps Correlation Summary
| Measurement | Black/African American | Immigrants from North America |
| Minimum | 9.1% | 2.1% |
| Maximum | 40.0% | 100.0% |
| Range | 31.0% | 97.9% |
| Mean | 20.3% | 14.4% |
| Median | 20.0% | 9.6% |
| Interquartile 25% (IQ1) | 14.7% | 6.7% |
| Interquartile 75% (IQ3) | 25.0% | 17.4% |
| Interquartile Range (IQR) | 10.3% | 10.7% |
| Standard Deviation (Sample) | 6.8% | 17.1% |
| Standard Deviation (Population) | 6.8% | 16.9% |
Similar Demographics by Receiving Food Stamps
Demographics Similar to Blacks/African Americans by Receiving Food Stamps
In terms of receiving food stamps, the demographic groups most similar to Blacks/African Americans are Menominee (17.2%, a difference of 0.17%), Immigrants from St. Vincent and the Grenadines (17.2%, a difference of 0.35%), Immigrants from Nicaragua (17.2%, a difference of 0.43%), Central American Indian (17.1%, a difference of 0.53%), and Native/Alaskan (17.3%, a difference of 0.62%).
| Demographics | Rating | Rank | Receiving Food Stamps |
| Immigrants | Barbados | 0.0 /100 | #310 | Tragic 16.6% |
| Guyanese | 0.0 /100 | #311 | Tragic 16.7% |
| Sioux | 0.0 /100 | #312 | Tragic 16.8% |
| Immigrants | Jamaica | 0.0 /100 | #313 | Tragic 16.9% |
| Immigrants | Guyana | 0.0 /100 | #314 | Tragic 16.9% |
| Bahamians | 0.0 /100 | #315 | Tragic 17.0% |
| Central American Indians | 0.0 /100 | #316 | Tragic 17.1% |
| Blacks/African Americans | 0.0 /100 | #317 | Tragic 17.2% |
| Menominee | 0.0 /100 | #318 | Tragic 17.2% |
| Immigrants | St. Vincent and the Grenadines | 0.0 /100 | #319 | Tragic 17.2% |
| Immigrants | Nicaragua | 0.0 /100 | #320 | Tragic 17.2% |
| Natives/Alaskans | 0.0 /100 | #321 | Tragic 17.3% |
| Immigrants | Grenada | 0.0 /100 | #322 | Tragic 17.8% |
| Haitians | 0.0 /100 | #323 | Tragic 17.8% |
| British West Indians | 0.0 /100 | #324 | Tragic 17.9% |
Demographics Similar to Immigrants from North America by Receiving Food Stamps
In terms of receiving food stamps, the demographic groups most similar to Immigrants from North America are Chinese (9.8%, a difference of 0.090%), Immigrants from Bulgaria (9.8%, a difference of 0.12%), Immigrants from Turkey (9.8%, a difference of 0.17%), English (9.8%, a difference of 0.19%), and German (9.7%, a difference of 0.34%).
| Demographics | Rating | Rank | Receiving Food Stamps |
| Greeks | 99.3 /100 | #57 | Exceptional 9.7% |
| Scandinavians | 99.2 /100 | #58 | Exceptional 9.7% |
| British | 99.2 /100 | #59 | Exceptional 9.7% |
| Germans | 99.2 /100 | #60 | Exceptional 9.7% |
| English | 99.2 /100 | #61 | Exceptional 9.8% |
| Immigrants | Bulgaria | 99.2 /100 | #62 | Exceptional 9.8% |
| Chinese | 99.2 /100 | #63 | Exceptional 9.8% |
| Immigrants | North America | 99.2 /100 | #64 | Exceptional 9.8% |
| Immigrants | Turkey | 99.1 /100 | #65 | Exceptional 9.8% |
| Slovenes | 99.1 /100 | #66 | Exceptional 9.8% |
| Immigrants | Indonesia | 99.0 /100 | #67 | Exceptional 9.8% |
| Northern Europeans | 99.0 /100 | #68 | Exceptional 9.8% |
| Italians | 99.0 /100 | #69 | Exceptional 9.9% |
| Immigrants | Serbia | 99.0 /100 | #70 | Exceptional 9.9% |
| Scottish | 98.9 /100 | #71 | Exceptional 9.9% |