Black/African American vs Immigrants from North Macedonia Receiving Food Stamps
COMPARE
Black/African American
Immigrants from North Macedonia
Receiving Food Stamps
Receiving Food Stamps Comparison
Blacks/African Americans
Immigrants from North Macedonia
17.2%
RECEIVING FOOD STAMPS
0.0/ 100
METRIC RATING
317th/ 347
METRIC RANK
10.0%
RECEIVING FOOD STAMPS
98.7/ 100
METRIC RATING
77th/ 347
METRIC RANK
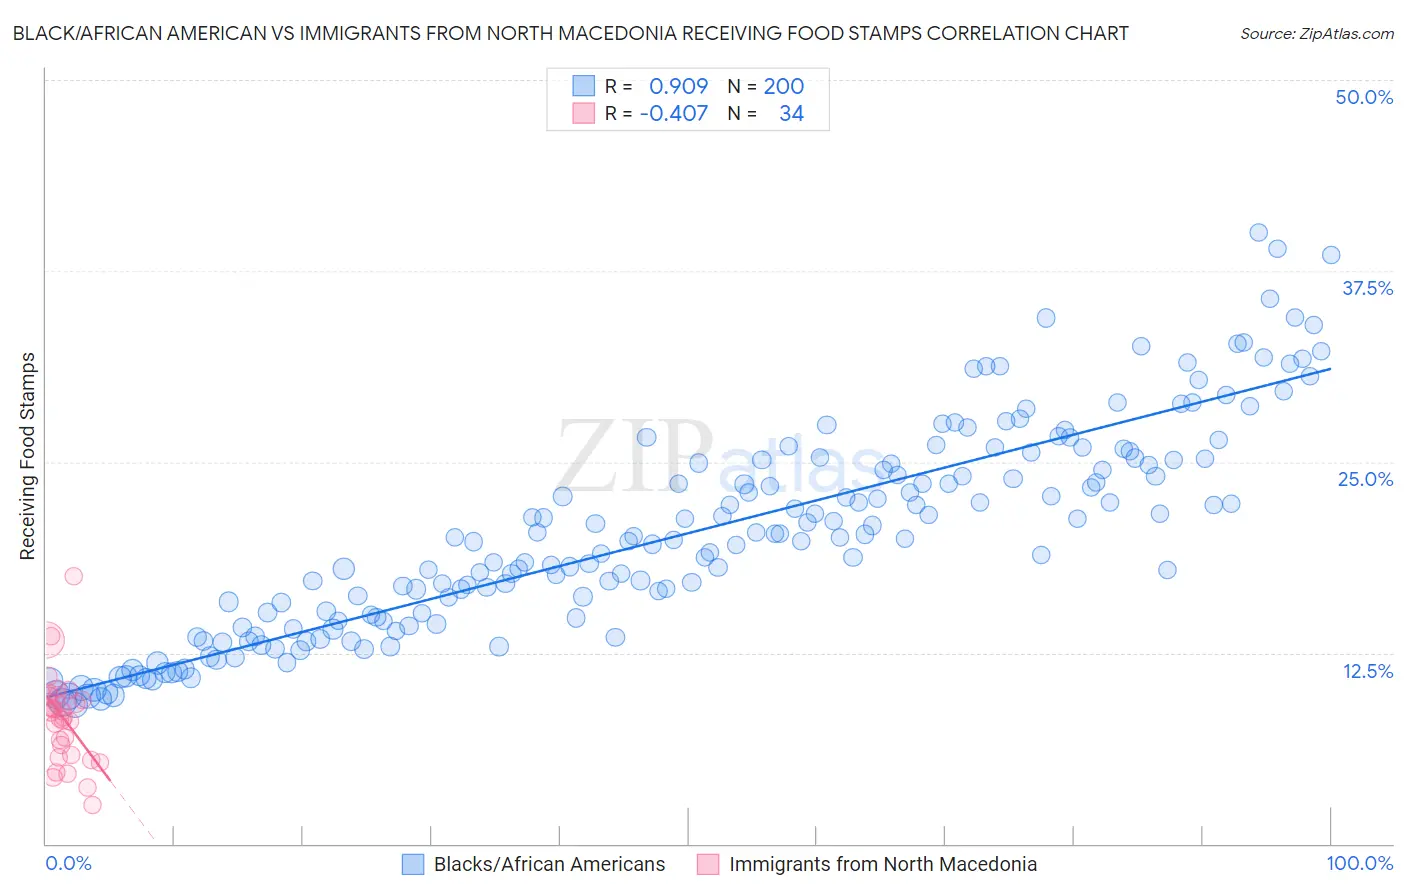
Black/African American vs Immigrants from North Macedonia Receiving Food Stamps Correlation Chart
The statistical analysis conducted on geographies consisting of 562,963,519 people shows a near-perfect positive correlation between the proportion of Blacks/African Americans and percentage of population receiving government assistance and/or food stamps in the United States with a correlation coefficient (R) of 0.909 and weighted average of 17.2%. Similarly, the statistical analysis conducted on geographies consisting of 74,225,836 people shows a moderate negative correlation between the proportion of Immigrants from North Macedonia and percentage of population receiving government assistance and/or food stamps in the United States with a correlation coefficient (R) of -0.407 and weighted average of 10.0%, a difference of 72.4%.
Receiving Food Stamps Correlation Summary
| Measurement | Black/African American | Immigrants from North Macedonia |
| Minimum | 9.1% | 2.5% |
| Maximum | 40.0% | 17.5% |
| Range | 31.0% | 15.0% |
| Mean | 20.3% | 8.2% |
| Median | 20.0% | 8.4% |
| Interquartile 25% (IQ1) | 14.7% | 5.8% |
| Interquartile 75% (IQ3) | 25.0% | 9.7% |
| Interquartile Range (IQR) | 10.3% | 3.9% |
| Standard Deviation (Sample) | 6.8% | 3.0% |
| Standard Deviation (Population) | 6.8% | 3.0% |
Similar Demographics by Receiving Food Stamps
Demographics Similar to Blacks/African Americans by Receiving Food Stamps
In terms of receiving food stamps, the demographic groups most similar to Blacks/African Americans are Menominee (17.2%, a difference of 0.17%), Immigrants from St. Vincent and the Grenadines (17.2%, a difference of 0.35%), Immigrants from Nicaragua (17.2%, a difference of 0.43%), Central American Indian (17.1%, a difference of 0.53%), and Native/Alaskan (17.3%, a difference of 0.62%).
| Demographics | Rating | Rank | Receiving Food Stamps |
| Immigrants | Barbados | 0.0 /100 | #310 | Tragic 16.6% |
| Guyanese | 0.0 /100 | #311 | Tragic 16.7% |
| Sioux | 0.0 /100 | #312 | Tragic 16.8% |
| Immigrants | Jamaica | 0.0 /100 | #313 | Tragic 16.9% |
| Immigrants | Guyana | 0.0 /100 | #314 | Tragic 16.9% |
| Bahamians | 0.0 /100 | #315 | Tragic 17.0% |
| Central American Indians | 0.0 /100 | #316 | Tragic 17.1% |
| Blacks/African Americans | 0.0 /100 | #317 | Tragic 17.2% |
| Menominee | 0.0 /100 | #318 | Tragic 17.2% |
| Immigrants | St. Vincent and the Grenadines | 0.0 /100 | #319 | Tragic 17.2% |
| Immigrants | Nicaragua | 0.0 /100 | #320 | Tragic 17.2% |
| Natives/Alaskans | 0.0 /100 | #321 | Tragic 17.3% |
| Immigrants | Grenada | 0.0 /100 | #322 | Tragic 17.8% |
| Haitians | 0.0 /100 | #323 | Tragic 17.8% |
| British West Indians | 0.0 /100 | #324 | Tragic 17.9% |
Demographics Similar to Immigrants from North Macedonia by Receiving Food Stamps
In terms of receiving food stamps, the demographic groups most similar to Immigrants from North Macedonia are South African (10.0%, a difference of 0.050%), Immigrants from Croatia (10.0%, a difference of 0.080%), Laotian (10.0%, a difference of 0.080%), Immigrants from Zimbabwe (9.9%, a difference of 0.090%), and Polish (10.0%, a difference of 0.16%).
| Demographics | Rating | Rank | Receiving Food Stamps |
| Immigrants | Serbia | 99.0 /100 | #70 | Exceptional 9.9% |
| Scottish | 98.9 /100 | #71 | Exceptional 9.9% |
| Immigrants | Asia | 98.9 /100 | #72 | Exceptional 9.9% |
| Macedonians | 98.9 /100 | #73 | Exceptional 9.9% |
| New Zealanders | 98.8 /100 | #74 | Exceptional 9.9% |
| Immigrants | Zimbabwe | 98.7 /100 | #75 | Exceptional 9.9% |
| Immigrants | Croatia | 98.7 /100 | #76 | Exceptional 10.0% |
| Immigrants | North Macedonia | 98.7 /100 | #77 | Exceptional 10.0% |
| South Africans | 98.7 /100 | #78 | Exceptional 10.0% |
| Laotians | 98.7 /100 | #79 | Exceptional 10.0% |
| Poles | 98.6 /100 | #80 | Exceptional 10.0% |
| Immigrants | England | 98.6 /100 | #81 | Exceptional 10.0% |
| Austrians | 98.6 /100 | #82 | Exceptional 10.0% |
| Dutch | 98.6 /100 | #83 | Exceptional 10.0% |
| Immigrants | Israel | 98.5 /100 | #84 | Exceptional 10.0% |