Immigrants from Nigeria vs Portuguese Receiving Food Stamps
COMPARE
Immigrants from Nigeria
Portuguese
Receiving Food Stamps
Receiving Food Stamps Comparison
Immigrants from Nigeria
Portuguese
13.1%
RECEIVING FOOD STAMPS
3.4/ 100
METRIC RATING
231st/ 347
METRIC RANK
12.2%
RECEIVING FOOD STAMPS
25.1/ 100
METRIC RATING
199th/ 347
METRIC RANK
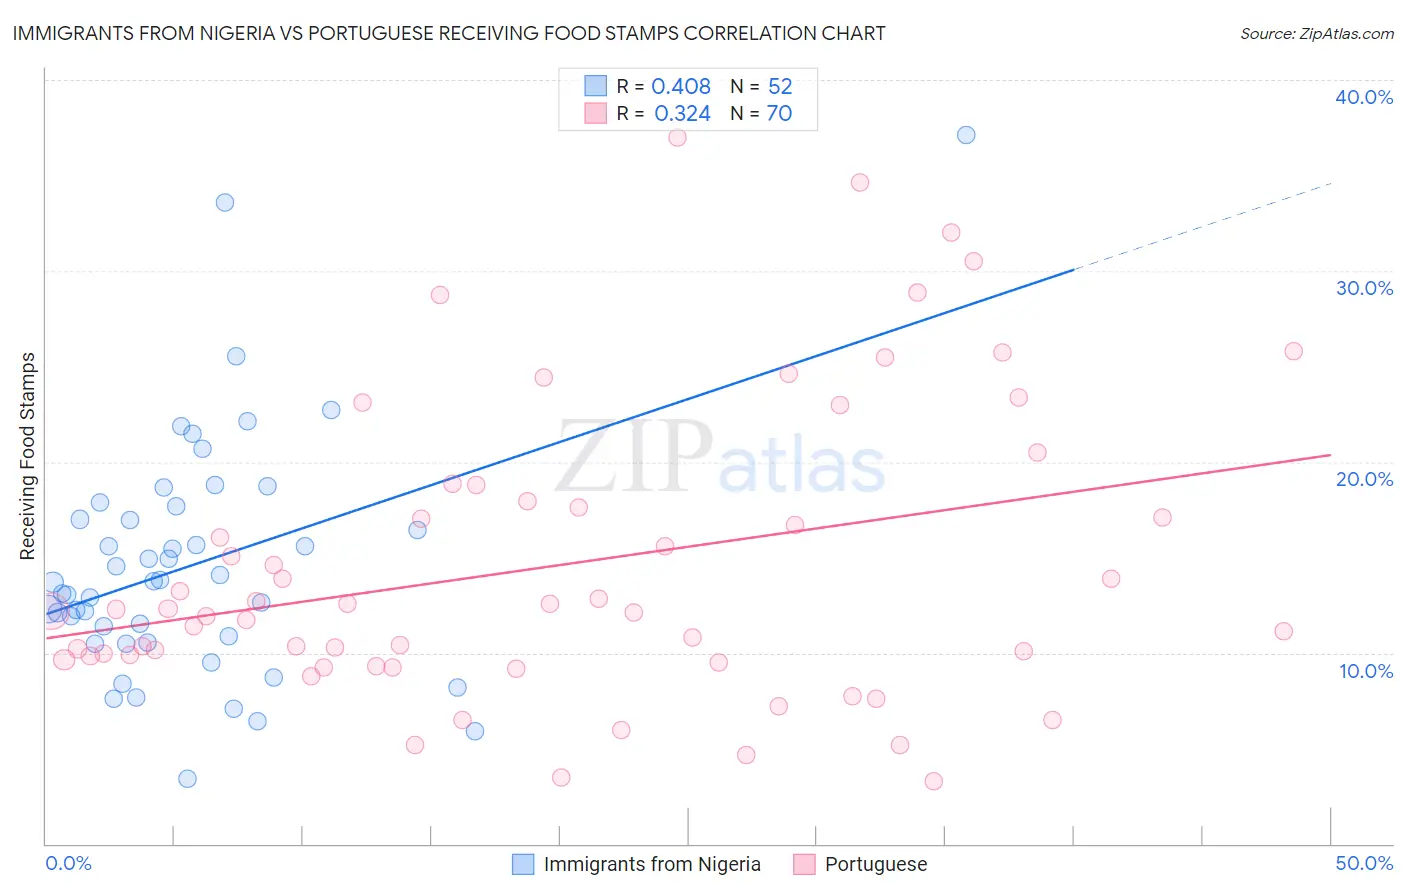
Immigrants from Nigeria vs Portuguese Receiving Food Stamps Correlation Chart
The statistical analysis conducted on geographies consisting of 282,993,216 people shows a moderate positive correlation between the proportion of Immigrants from Nigeria and percentage of population receiving government assistance and/or food stamps in the United States with a correlation coefficient (R) of 0.408 and weighted average of 13.1%. Similarly, the statistical analysis conducted on geographies consisting of 448,612,640 people shows a mild positive correlation between the proportion of Portuguese and percentage of population receiving government assistance and/or food stamps in the United States with a correlation coefficient (R) of 0.324 and weighted average of 12.2%, a difference of 7.6%.
Receiving Food Stamps Correlation Summary
| Measurement | Immigrants from Nigeria | Portuguese |
| Minimum | 3.4% | 3.3% |
| Maximum | 37.1% | 37.0% |
| Range | 33.7% | 33.7% |
| Mean | 14.6% | 14.6% |
| Median | 13.7% | 12.2% |
| Interquartile 25% (IQ1) | 10.7% | 9.6% |
| Interquartile 75% (IQ3) | 17.3% | 17.9% |
| Interquartile Range (IQR) | 6.6% | 8.3% |
| Standard Deviation (Sample) | 6.3% | 7.7% |
| Standard Deviation (Population) | 6.2% | 7.7% |
Similar Demographics by Receiving Food Stamps
Demographics Similar to Immigrants from Nigeria by Receiving Food Stamps
In terms of receiving food stamps, the demographic groups most similar to Immigrants from Nigeria are Puget Sound Salish (13.1%, a difference of 0.040%), Ottawa (13.1%, a difference of 0.090%), Panamanian (13.1%, a difference of 0.10%), Nigerian (13.1%, a difference of 0.11%), and Chickasaw (13.1%, a difference of 0.15%).
| Demographics | Rating | Rank | Receiving Food Stamps |
| Immigrants | Armenia | 4.3 /100 | #224 | Tragic 13.0% |
| Fijians | 4.3 /100 | #225 | Tragic 13.0% |
| Chickasaw | 3.6 /100 | #226 | Tragic 13.1% |
| Nigerians | 3.5 /100 | #227 | Tragic 13.1% |
| Panamanians | 3.5 /100 | #228 | Tragic 13.1% |
| Ottawa | 3.5 /100 | #229 | Tragic 13.1% |
| Puget Sound Salish | 3.4 /100 | #230 | Tragic 13.1% |
| Immigrants | Nigeria | 3.4 /100 | #231 | Tragic 13.1% |
| Salvadorans | 2.7 /100 | #232 | Tragic 13.2% |
| Cherokee | 2.5 /100 | #233 | Tragic 13.2% |
| Comanche | 2.4 /100 | #234 | Tragic 13.3% |
| Immigrants | Zaire | 1.9 /100 | #235 | Tragic 13.4% |
| Crow | 1.6 /100 | #236 | Tragic 13.4% |
| Immigrants | El Salvador | 1.5 /100 | #237 | Tragic 13.5% |
| French American Indians | 1.4 /100 | #238 | Tragic 13.5% |
Demographics Similar to Portuguese by Receiving Food Stamps
In terms of receiving food stamps, the demographic groups most similar to Portuguese are Immigrants from Costa Rica (12.2%, a difference of 0.050%), Delaware (12.2%, a difference of 0.18%), Iraqi (12.2%, a difference of 0.26%), Sierra Leonean (12.2%, a difference of 0.28%), and American (12.2%, a difference of 0.29%).
| Demographics | Rating | Rank | Receiving Food Stamps |
| Samoans | 31.0 /100 | #192 | Fair 12.1% |
| Immigrants | Fiji | 27.8 /100 | #193 | Fair 12.1% |
| Immigrants | Sudan | 27.1 /100 | #194 | Fair 12.1% |
| Americans | 26.7 /100 | #195 | Fair 12.2% |
| Iraqis | 26.6 /100 | #196 | Fair 12.2% |
| Delaware | 26.1 /100 | #197 | Fair 12.2% |
| Immigrants | Costa Rica | 25.4 /100 | #198 | Fair 12.2% |
| Portuguese | 25.1 /100 | #199 | Fair 12.2% |
| Sierra Leoneans | 23.6 /100 | #200 | Fair 12.2% |
| Ugandans | 22.5 /100 | #201 | Fair 12.2% |
| Immigrants | Venezuela | 20.1 /100 | #202 | Fair 12.3% |
| Shoshone | 17.7 /100 | #203 | Poor 12.4% |
| Immigrants | Nonimmigrants | 17.6 /100 | #204 | Poor 12.4% |
| Aleuts | 17.3 /100 | #205 | Poor 12.4% |
| Immigrants | Thailand | 17.0 /100 | #206 | Poor 12.4% |