Black/African American vs Portuguese Unemployment Among Youth under 25 years
COMPARE
Black/African American
Portuguese
Unemployment Among Youth under 25 years
Unemployment Among Youth under 25 years Comparison
Blacks/African Americans
Portuguese
14.5%
UNEMPLOYMENT AMONG YOUTH UNDER 25 YEARS
0.0/ 100
METRIC RATING
317th/ 347
METRIC RANK
11.7%
UNEMPLOYMENT AMONG YOUTH UNDER 25 YEARS
30.3/ 100
METRIC RATING
190th/ 347
METRIC RANK
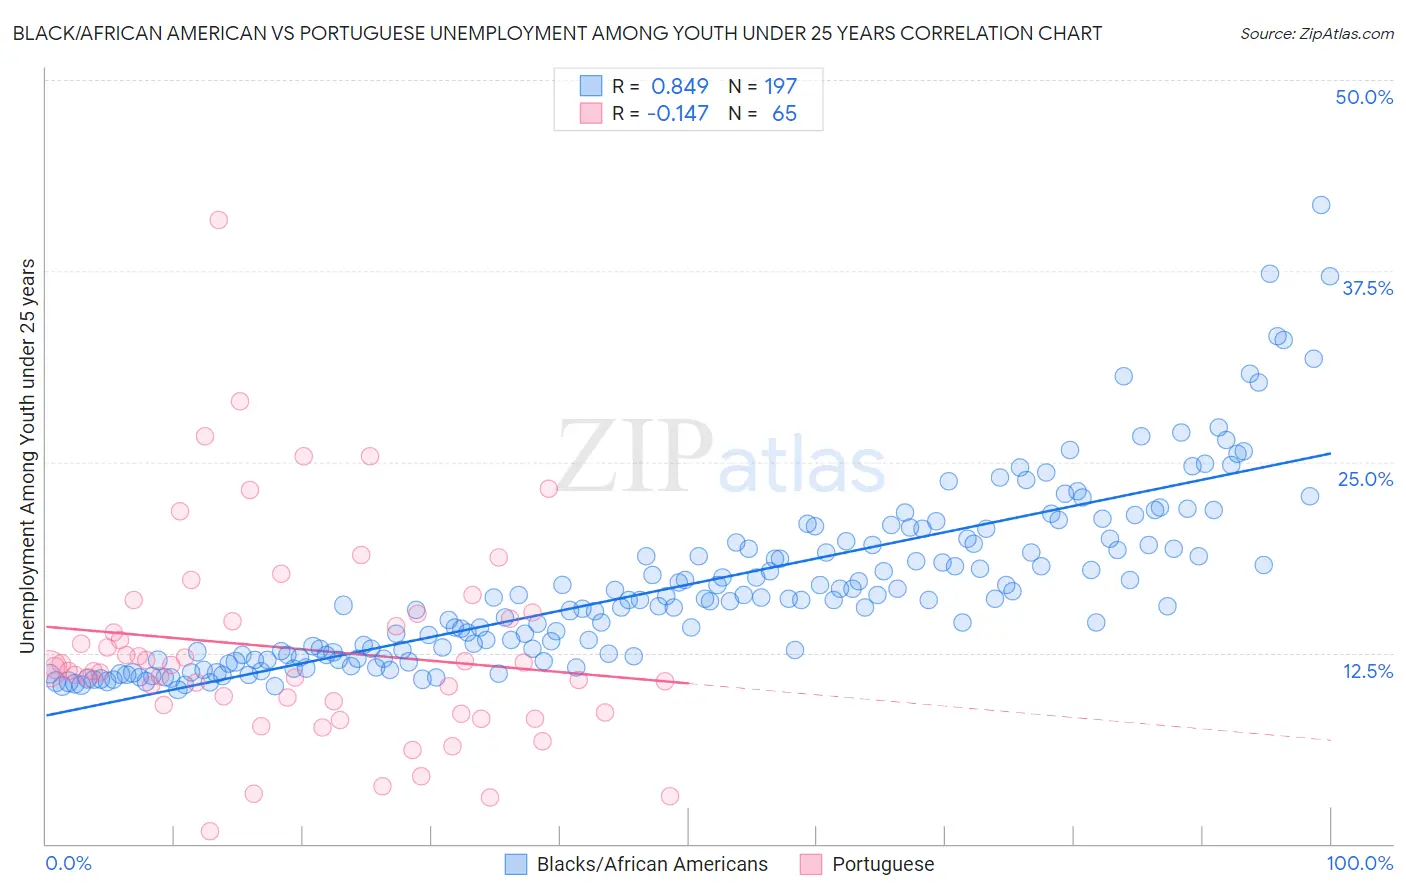
Black/African American vs Portuguese Unemployment Among Youth under 25 years Correlation Chart
The statistical analysis conducted on geographies consisting of 545,283,249 people shows a very strong positive correlation between the proportion of Blacks/African Americans and unemployment rate among youth under the age of 25 in the United States with a correlation coefficient (R) of 0.849 and weighted average of 14.5%. Similarly, the statistical analysis conducted on geographies consisting of 441,524,609 people shows a poor negative correlation between the proportion of Portuguese and unemployment rate among youth under the age of 25 in the United States with a correlation coefficient (R) of -0.147 and weighted average of 11.7%, a difference of 23.7%.
Unemployment Among Youth under 25 years Correlation Summary
| Measurement | Black/African American | Portuguese |
| Minimum | 10.1% | 0.80% |
| Maximum | 41.8% | 40.8% |
| Range | 31.7% | 40.0% |
| Mean | 16.9% | 12.7% |
| Median | 15.9% | 11.4% |
| Interquartile 25% (IQ1) | 12.2% | 8.9% |
| Interquartile 75% (IQ3) | 19.6% | 14.9% |
| Interquartile Range (IQR) | 7.4% | 6.0% |
| Standard Deviation (Sample) | 5.8% | 6.8% |
| Standard Deviation (Population) | 5.8% | 6.8% |
Similar Demographics by Unemployment Among Youth under 25 years
Demographics Similar to Blacks/African Americans by Unemployment Among Youth under 25 years
In terms of unemployment among youth under 25 years, the demographic groups most similar to Blacks/African Americans are Native/Alaskan (14.5%, a difference of 0.090%), Sioux (14.4%, a difference of 0.51%), Jamaican (14.4%, a difference of 0.63%), Immigrants from Armenia (14.4%, a difference of 0.71%), and Immigrants from Dominica (14.6%, a difference of 0.72%).
| Demographics | Rating | Rank | Unemployment Among Youth under 25 years |
| Immigrants | West Indies | 0.0 /100 | #310 | Tragic 14.2% |
| Immigrants | Bangladesh | 0.0 /100 | #311 | Tragic 14.2% |
| Vietnamese | 0.0 /100 | #312 | Tragic 14.3% |
| Immigrants | Armenia | 0.0 /100 | #313 | Tragic 14.4% |
| Jamaicans | 0.0 /100 | #314 | Tragic 14.4% |
| Sioux | 0.0 /100 | #315 | Tragic 14.4% |
| Natives/Alaskans | 0.0 /100 | #316 | Tragic 14.5% |
| Blacks/African Americans | 0.0 /100 | #317 | Tragic 14.5% |
| Immigrants | Dominica | 0.0 /100 | #318 | Tragic 14.6% |
| West Indians | 0.0 /100 | #319 | Tragic 14.6% |
| Barbadians | 0.0 /100 | #320 | Tragic 14.6% |
| Cheyenne | 0.0 /100 | #321 | Tragic 14.6% |
| Trinidadians and Tobagonians | 0.0 /100 | #322 | Tragic 14.6% |
| Immigrants | Trinidad and Tobago | 0.0 /100 | #323 | Tragic 14.6% |
| Immigrants | Jamaica | 0.0 /100 | #324 | Tragic 14.8% |
Demographics Similar to Portuguese by Unemployment Among Youth under 25 years
In terms of unemployment among youth under 25 years, the demographic groups most similar to Portuguese are Japanese (11.7%, a difference of 0.020%), Immigrants from Poland (11.7%, a difference of 0.050%), Immigrants from Egypt (11.7%, a difference of 0.080%), Cypriot (11.7%, a difference of 0.090%), and Immigrants from Russia (11.7%, a difference of 0.090%).
| Demographics | Rating | Rank | Unemployment Among Youth under 25 years |
| Americans | 34.5 /100 | #183 | Fair 11.7% |
| Immigrants | Eastern Europe | 34.1 /100 | #184 | Fair 11.7% |
| French American Indians | 34.0 /100 | #185 | Fair 11.7% |
| Maltese | 33.9 /100 | #186 | Fair 11.7% |
| Immigrants | Egypt | 31.9 /100 | #187 | Fair 11.7% |
| Immigrants | Poland | 31.4 /100 | #188 | Fair 11.7% |
| Japanese | 30.8 /100 | #189 | Fair 11.7% |
| Portuguese | 30.3 /100 | #190 | Fair 11.7% |
| Cypriots | 28.5 /100 | #191 | Fair 11.7% |
| Immigrants | Russia | 28.5 /100 | #192 | Fair 11.7% |
| Seminole | 27.9 /100 | #193 | Fair 11.7% |
| Immigrants | Sri Lanka | 27.8 /100 | #194 | Fair 11.7% |
| Paraguayans | 27.2 /100 | #195 | Fair 11.7% |
| Egyptians | 26.9 /100 | #196 | Fair 11.7% |
| Koreans | 23.9 /100 | #197 | Fair 11.7% |