Black/African American vs Portuguese Unemployment Among Ages 65 to 74 years
COMPARE
Black/African American
Portuguese
Unemployment Among Ages 65 to 74 years
Unemployment Among Ages 65 to 74 years Comparison
Blacks/African Americans
Portuguese
5.8%
UNEMPLOYMENT AMONG AGES 65 TO 74 YEARS
0.0/ 100
METRIC RATING
295th/ 347
METRIC RANK
5.7%
UNEMPLOYMENT AMONG AGES 65 TO 74 YEARS
0.0/ 100
METRIC RATING
291st/ 347
METRIC RANK
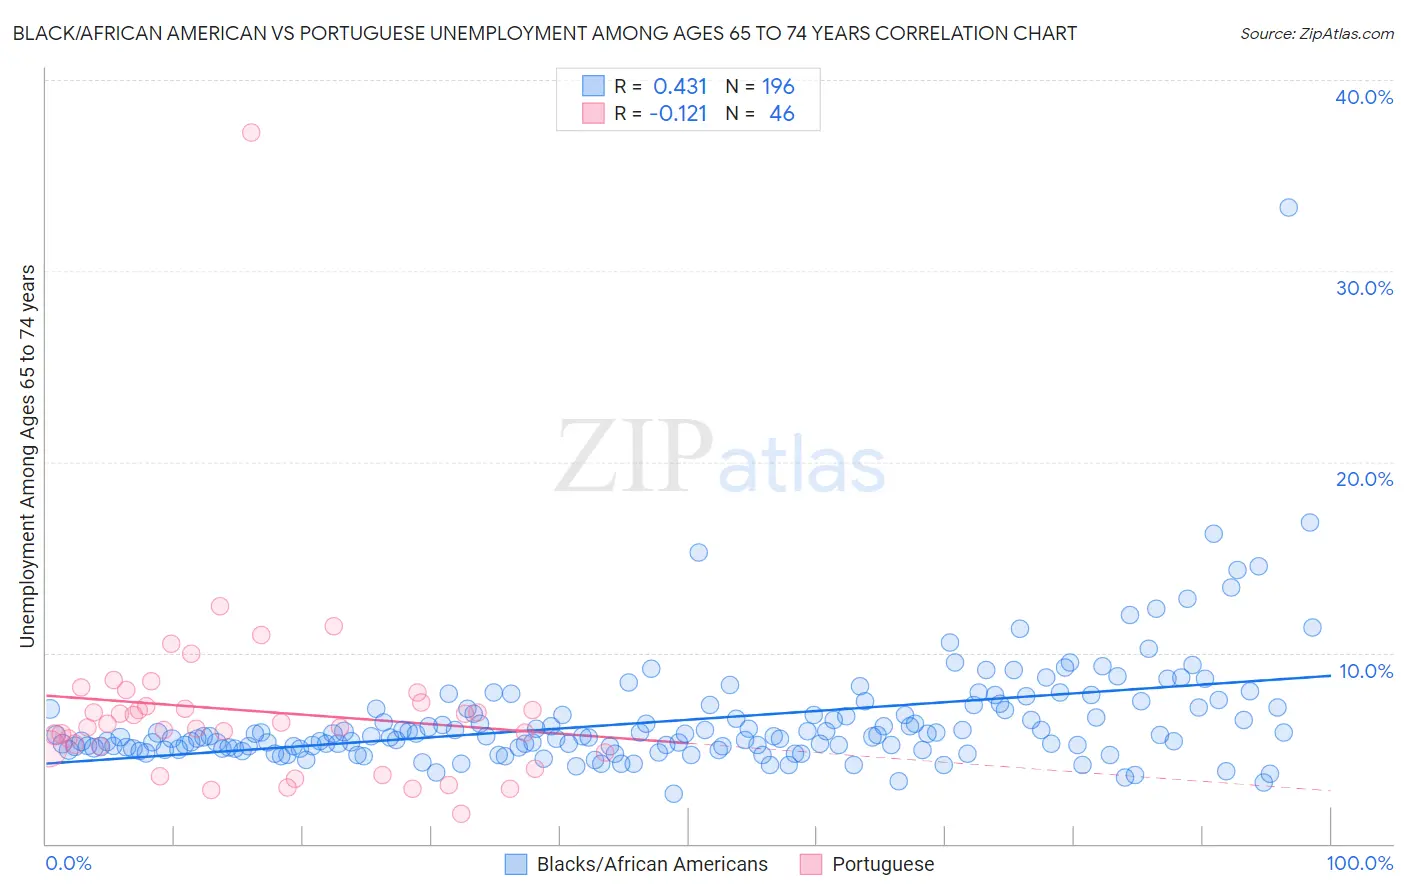
Black/African American vs Portuguese Unemployment Among Ages 65 to 74 years Correlation Chart
The statistical analysis conducted on geographies consisting of 445,511,651 people shows a moderate positive correlation between the proportion of Blacks/African Americans and unemployment rate among population between the ages 65 and 74 in the United States with a correlation coefficient (R) of 0.431 and weighted average of 5.8%. Similarly, the statistical analysis conducted on geographies consisting of 385,417,799 people shows a poor negative correlation between the proportion of Portuguese and unemployment rate among population between the ages 65 and 74 in the United States with a correlation coefficient (R) of -0.121 and weighted average of 5.7%, a difference of 0.38%.
Unemployment Among Ages 65 to 74 years Correlation Summary
| Measurement | Black/African American | Portuguese |
| Minimum | 2.6% | 1.6% |
| Maximum | 33.3% | 37.2% |
| Range | 30.7% | 35.6% |
| Mean | 6.5% | 7.0% |
| Median | 5.6% | 6.2% |
| Interquartile 25% (IQ1) | 5.0% | 5.0% |
| Interquartile 75% (IQ3) | 7.1% | 7.4% |
| Interquartile Range (IQR) | 2.1% | 2.4% |
| Standard Deviation (Sample) | 3.0% | 5.1% |
| Standard Deviation (Population) | 3.0% | 5.1% |
Demographics Similar to Blacks/African Americans and Portuguese by Unemployment Among Ages 65 to 74 years
In terms of unemployment among ages 65 to 74 years, the demographic groups most similar to Blacks/African Americans are Immigrants from Morocco (5.8%, a difference of 0.030%), Immigrants from Grenada (5.8%, a difference of 0.060%), U.S. Virgin Islander (5.8%, a difference of 0.16%), Spanish American Indian (5.7%, a difference of 0.41%), and Pennsylvania German (5.8%, a difference of 0.46%). Similarly, the demographic groups most similar to Portuguese are Spanish American Indian (5.7%, a difference of 0.040%), U.S. Virgin Islander (5.8%, a difference of 0.22%), Immigrants from Somalia (5.7%, a difference of 0.29%), Central American (5.7%, a difference of 0.30%), and Immigrants from Grenada (5.8%, a difference of 0.32%).
| Demographics | Rating | Rank | Unemployment Among Ages 65 to 74 years |
| Cypriots | 0.1 /100 | #283 | Tragic 5.7% |
| Chippewa | 0.1 /100 | #284 | Tragic 5.7% |
| Immigrants | Sierra Leone | 0.1 /100 | #285 | Tragic 5.7% |
| Marshallese | 0.1 /100 | #286 | Tragic 5.7% |
| Central American Indians | 0.0 /100 | #287 | Tragic 5.7% |
| Central Americans | 0.0 /100 | #288 | Tragic 5.7% |
| Immigrants | Somalia | 0.0 /100 | #289 | Tragic 5.7% |
| Spanish American Indians | 0.0 /100 | #290 | Tragic 5.7% |
| Portuguese | 0.0 /100 | #291 | Tragic 5.7% |
| U.S. Virgin Islanders | 0.0 /100 | #292 | Tragic 5.8% |
| Immigrants | Grenada | 0.0 /100 | #293 | Tragic 5.8% |
| Immigrants | Morocco | 0.0 /100 | #294 | Tragic 5.8% |
| Blacks/African Americans | 0.0 /100 | #295 | Tragic 5.8% |
| Pennsylvania Germans | 0.0 /100 | #296 | Tragic 5.8% |
| Houma | 0.0 /100 | #297 | Tragic 5.8% |
| Immigrants | Latin America | 0.0 /100 | #298 | Tragic 5.8% |
| Barbadians | 0.0 /100 | #299 | Tragic 5.8% |
| Ecuadorians | 0.0 /100 | #300 | Tragic 5.8% |
| Armenians | 0.0 /100 | #301 | Tragic 5.8% |
| Liberians | 0.0 /100 | #302 | Tragic 5.8% |
| Arapaho | 0.0 /100 | #303 | Tragic 5.8% |