Barbadian vs Immigrants from Thailand Single Male Poverty
COMPARE
Barbadian
Immigrants from Thailand
Single Male Poverty
Single Male Poverty Comparison
Barbadians
Immigrants from Thailand
13.4%
SINGLE MALE POVERTY
2.1/ 100
METRIC RATING
243rd/ 347
METRIC RANK
13.0%
SINGLE MALE POVERTY
26.6/ 100
METRIC RATING
191st/ 347
METRIC RANK
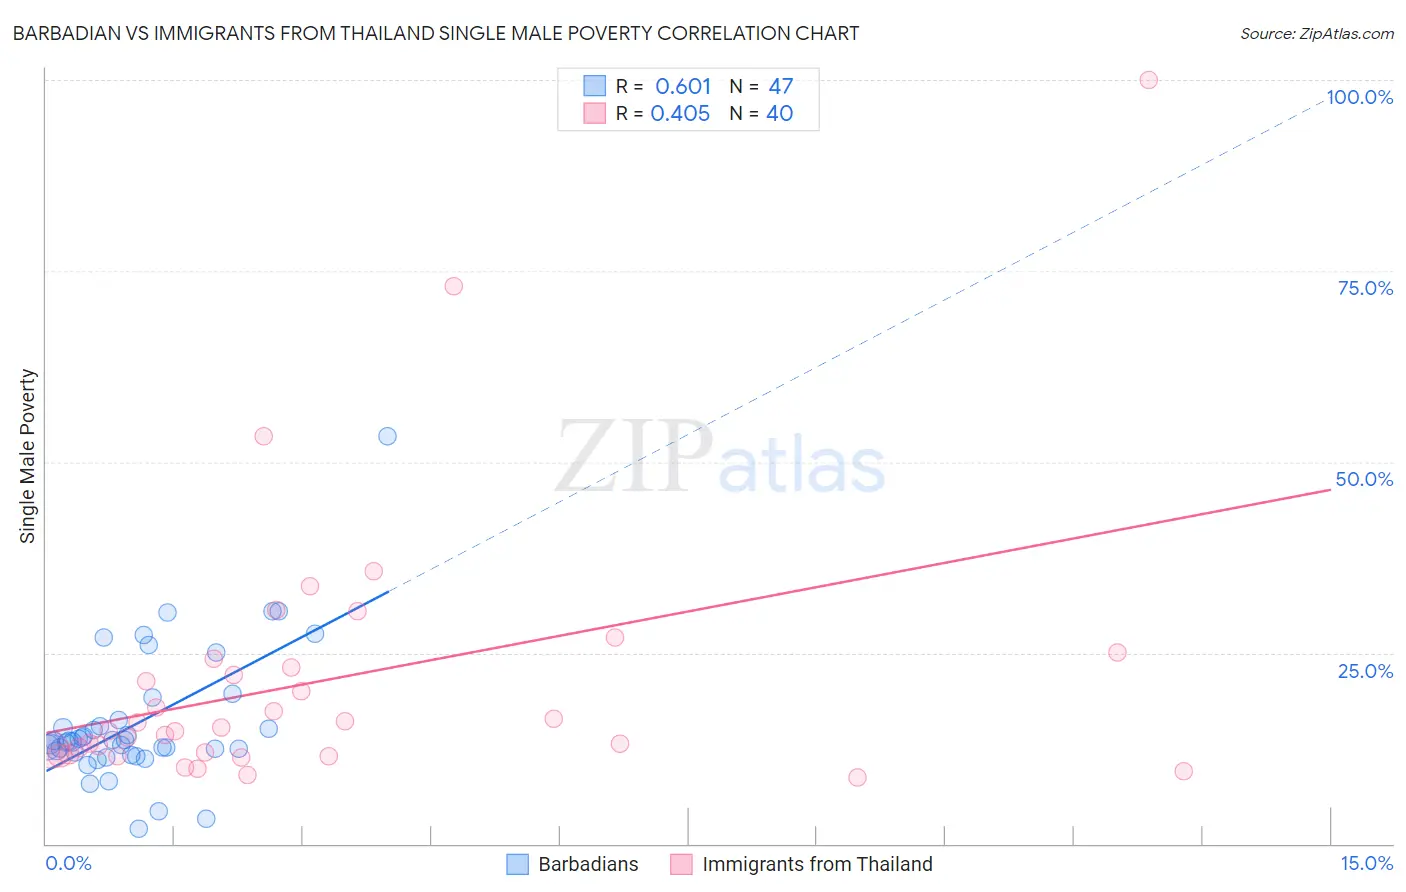
Barbadian vs Immigrants from Thailand Single Male Poverty Correlation Chart
The statistical analysis conducted on geographies consisting of 135,240,511 people shows a significant positive correlation between the proportion of Barbadians and poverty level among single males in the United States with a correlation coefficient (R) of 0.601 and weighted average of 13.4%. Similarly, the statistical analysis conducted on geographies consisting of 289,372,326 people shows a moderate positive correlation between the proportion of Immigrants from Thailand and poverty level among single males in the United States with a correlation coefficient (R) of 0.405 and weighted average of 13.0%, a difference of 3.7%.
Single Male Poverty Correlation Summary
| Measurement | Barbadian | Immigrants from Thailand |
| Minimum | 2.0% | 8.7% |
| Maximum | 53.3% | 100.0% |
| Range | 51.3% | 91.3% |
| Mean | 15.9% | 21.4% |
| Median | 13.4% | 15.0% |
| Interquartile 25% (IQ1) | 12.0% | 11.8% |
| Interquartile 75% (IQ3) | 16.2% | 23.6% |
| Interquartile Range (IQR) | 4.2% | 11.8% |
| Standard Deviation (Sample) | 8.8% | 17.9% |
| Standard Deviation (Population) | 8.7% | 17.7% |
Similar Demographics by Single Male Poverty
Demographics Similar to Barbadians by Single Male Poverty
In terms of single male poverty, the demographic groups most similar to Barbadians are Carpatho Rusyn (13.4%, a difference of 0.050%), Immigrants from Germany (13.4%, a difference of 0.060%), Belizean (13.4%, a difference of 0.17%), Immigrants from Senegal (13.5%, a difference of 0.28%), and Czechoslovakian (13.4%, a difference of 0.47%).
| Demographics | Rating | Rank | Single Male Poverty |
| Luxembourgers | 3.6 /100 | #236 | Tragic 13.4% |
| British West Indians | 3.4 /100 | #237 | Tragic 13.4% |
| Immigrants | Ghana | 3.2 /100 | #238 | Tragic 13.4% |
| Czechoslovakians | 3.0 /100 | #239 | Tragic 13.4% |
| Belizeans | 2.3 /100 | #240 | Tragic 13.4% |
| Immigrants | Germany | 2.1 /100 | #241 | Tragic 13.4% |
| Carpatho Rusyns | 2.1 /100 | #242 | Tragic 13.4% |
| Barbadians | 2.1 /100 | #243 | Tragic 13.4% |
| Immigrants | Senegal | 1.7 /100 | #244 | Tragic 13.5% |
| Immigrants | Latin America | 1.3 /100 | #245 | Tragic 13.5% |
| Immigrants | Micronesia | 1.2 /100 | #246 | Tragic 13.5% |
| Belgians | 1.2 /100 | #247 | Tragic 13.5% |
| Czechs | 1.2 /100 | #248 | Tragic 13.5% |
| Spanish | 1.0 /100 | #249 | Tragic 13.6% |
| Immigrants | Somalia | 1.0 /100 | #250 | Tragic 13.6% |
Demographics Similar to Immigrants from Thailand by Single Male Poverty
In terms of single male poverty, the demographic groups most similar to Immigrants from Thailand are Immigrants from Jamaica (13.0%, a difference of 0.010%), Arab (13.0%, a difference of 0.030%), Immigrants from South Africa (13.0%, a difference of 0.030%), Liberian (13.0%, a difference of 0.090%), and Immigrants from England (13.0%, a difference of 0.22%).
| Demographics | Rating | Rank | Single Male Poverty |
| Immigrants | Trinidad and Tobago | 32.5 /100 | #184 | Fair 12.9% |
| Norwegians | 32.0 /100 | #185 | Fair 12.9% |
| Nigerians | 31.9 /100 | #186 | Fair 12.9% |
| Immigrants | Kuwait | 31.9 /100 | #187 | Fair 12.9% |
| Macedonians | 31.5 /100 | #188 | Fair 12.9% |
| Portuguese | 30.2 /100 | #189 | Fair 12.9% |
| Arabs | 27.0 /100 | #190 | Fair 13.0% |
| Immigrants | Thailand | 26.6 /100 | #191 | Fair 13.0% |
| Immigrants | Jamaica | 26.5 /100 | #192 | Fair 13.0% |
| Immigrants | South Africa | 26.1 /100 | #193 | Fair 13.0% |
| Liberians | 25.2 /100 | #194 | Fair 13.0% |
| Immigrants | England | 23.4 /100 | #195 | Fair 13.0% |
| Immigrants | Grenada | 23.1 /100 | #196 | Fair 13.0% |
| Immigrants | Laos | 23.1 /100 | #197 | Fair 13.0% |
| Lithuanians | 22.1 /100 | #198 | Fair 13.0% |