Black/African American vs South African Female Poverty Among 18-24 Year Olds
COMPARE
Black/African American
South African
Female Poverty Among 18-24 Year Olds
Female Poverty Among 18-24 Year Olds Comparison
Blacks/African Americans
South Africans
24.3%
FEMALE POVERTY AMONG 18-24 YEAR OLDS
0.0/ 100
METRIC RATING
315th/ 347
METRIC RANK
21.1%
FEMALE POVERTY AMONG 18-24 YEAR OLDS
1.6/ 100
METRIC RATING
252nd/ 347
METRIC RANK
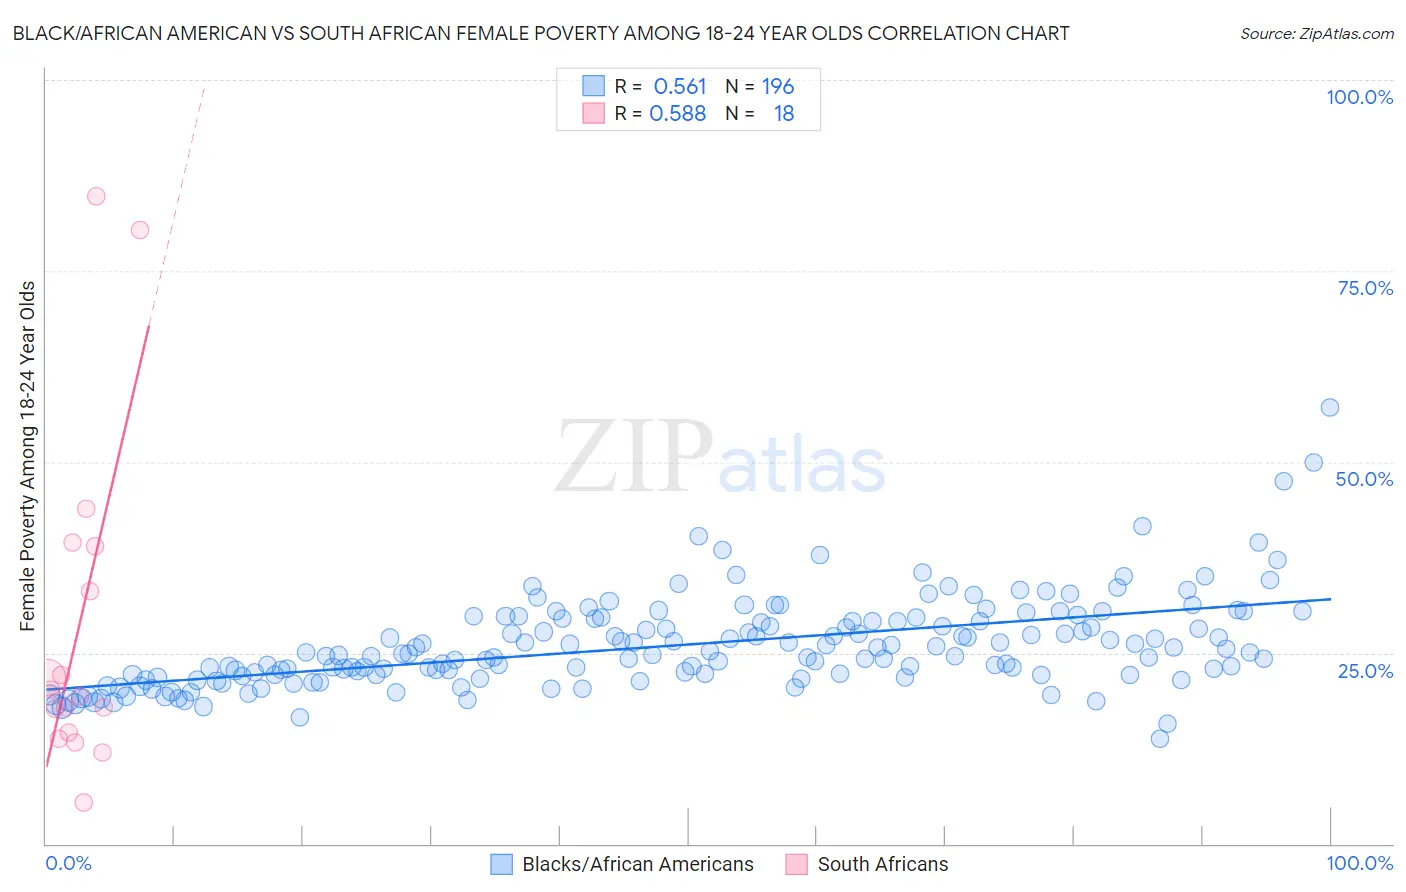
Black/African American vs South African Female Poverty Among 18-24 Year Olds Correlation Chart
The statistical analysis conducted on geographies consisting of 536,191,091 people shows a substantial positive correlation between the proportion of Blacks/African Americans and poverty level among females between the ages 18 and 24 in the United States with a correlation coefficient (R) of 0.561 and weighted average of 24.3%. Similarly, the statistical analysis conducted on geographies consisting of 180,070,920 people shows a substantial positive correlation between the proportion of South Africans and poverty level among females between the ages 18 and 24 in the United States with a correlation coefficient (R) of 0.588 and weighted average of 21.1%, a difference of 15.1%.
Female Poverty Among 18-24 Year Olds Correlation Summary
| Measurement | Black/African American | South African |
| Minimum | 13.7% | 5.5% |
| Maximum | 57.1% | 84.8% |
| Range | 43.4% | 79.4% |
| Mean | 26.0% | 28.7% |
| Median | 24.8% | 19.7% |
| Interquartile 25% (IQ1) | 22.0% | 14.6% |
| Interquartile 75% (IQ3) | 29.2% | 38.9% |
| Interquartile Range (IQR) | 7.2% | 24.3% |
| Standard Deviation (Sample) | 6.0% | 22.2% |
| Standard Deviation (Population) | 6.0% | 21.6% |
Similar Demographics by Female Poverty Among 18-24 Year Olds
Demographics Similar to Blacks/African Americans by Female Poverty Among 18-24 Year Olds
In terms of female poverty among 18-24 year olds, the demographic groups most similar to Blacks/African Americans are Choctaw (24.3%, a difference of 0.20%), Alsatian (24.4%, a difference of 0.31%), Creek (24.2%, a difference of 0.36%), Osage (24.5%, a difference of 0.60%), and Chickasaw (24.5%, a difference of 0.69%).
| Demographics | Rating | Rank | Female Poverty Among 18-24 Year Olds |
| Immigrants | Sudan | 0.0 /100 | #308 | Tragic 23.5% |
| Blackfeet | 0.0 /100 | #309 | Tragic 23.6% |
| Comanche | 0.0 /100 | #310 | Tragic 23.6% |
| Potawatomi | 0.0 /100 | #311 | Tragic 23.7% |
| Yuman | 0.0 /100 | #312 | Tragic 24.0% |
| Creek | 0.0 /100 | #313 | Tragic 24.2% |
| Choctaw | 0.0 /100 | #314 | Tragic 24.3% |
| Blacks/African Americans | 0.0 /100 | #315 | Tragic 24.3% |
| Alsatians | 0.0 /100 | #316 | Tragic 24.4% |
| Osage | 0.0 /100 | #317 | Tragic 24.5% |
| Chickasaw | 0.0 /100 | #318 | Tragic 24.5% |
| Dutch West Indians | 0.0 /100 | #319 | Tragic 24.5% |
| Immigrants | Congo | 0.0 /100 | #320 | Tragic 24.6% |
| Immigrants | Zaire | 0.0 /100 | #321 | Tragic 25.1% |
| Somalis | 0.0 /100 | #322 | Tragic 25.1% |
Demographics Similar to South Africans by Female Poverty Among 18-24 Year Olds
In terms of female poverty among 18-24 year olds, the demographic groups most similar to South Africans are Delaware (21.1%, a difference of 0.040%), West Indian (21.1%, a difference of 0.18%), British West Indian (21.2%, a difference of 0.33%), Immigrants from Grenada (21.2%, a difference of 0.36%), and Immigrants from West Indies (21.0%, a difference of 0.38%).
| Demographics | Rating | Rank | Female Poverty Among 18-24 Year Olds |
| Aleuts | 3.3 /100 | #245 | Tragic 20.9% |
| Immigrants | Australia | 3.1 /100 | #246 | Tragic 20.9% |
| Immigrants | Africa | 3.0 /100 | #247 | Tragic 21.0% |
| Immigrants | Kenya | 2.5 /100 | #248 | Tragic 21.0% |
| Carpatho Rusyns | 2.5 /100 | #249 | Tragic 21.0% |
| Immigrants | West Indies | 2.2 /100 | #250 | Tragic 21.0% |
| West Indians | 1.9 /100 | #251 | Tragic 21.1% |
| South Africans | 1.6 /100 | #252 | Tragic 21.1% |
| Delaware | 1.6 /100 | #253 | Tragic 21.1% |
| British West Indians | 1.2 /100 | #254 | Tragic 21.2% |
| Immigrants | Grenada | 1.2 /100 | #255 | Tragic 21.2% |
| Tsimshian | 1.0 /100 | #256 | Tragic 21.2% |
| Taiwanese | 1.0 /100 | #257 | Tragic 21.2% |
| Vietnamese | 0.6 /100 | #258 | Tragic 21.4% |
| Immigrants | France | 0.6 /100 | #259 | Tragic 21.4% |