Black/African American vs Immigrants from Western Europe Female Poverty Among 18-24 Year Olds
COMPARE
Black/African American
Immigrants from Western Europe
Female Poverty Among 18-24 Year Olds
Female Poverty Among 18-24 Year Olds Comparison
Blacks/African Americans
Immigrants from Western Europe
24.3%
FEMALE POVERTY AMONG 18-24 YEAR OLDS
0.0/ 100
METRIC RATING
315th/ 347
METRIC RANK
20.6%
FEMALE POVERTY AMONG 18-24 YEAR OLDS
13.5/ 100
METRIC RATING
211th/ 347
METRIC RANK
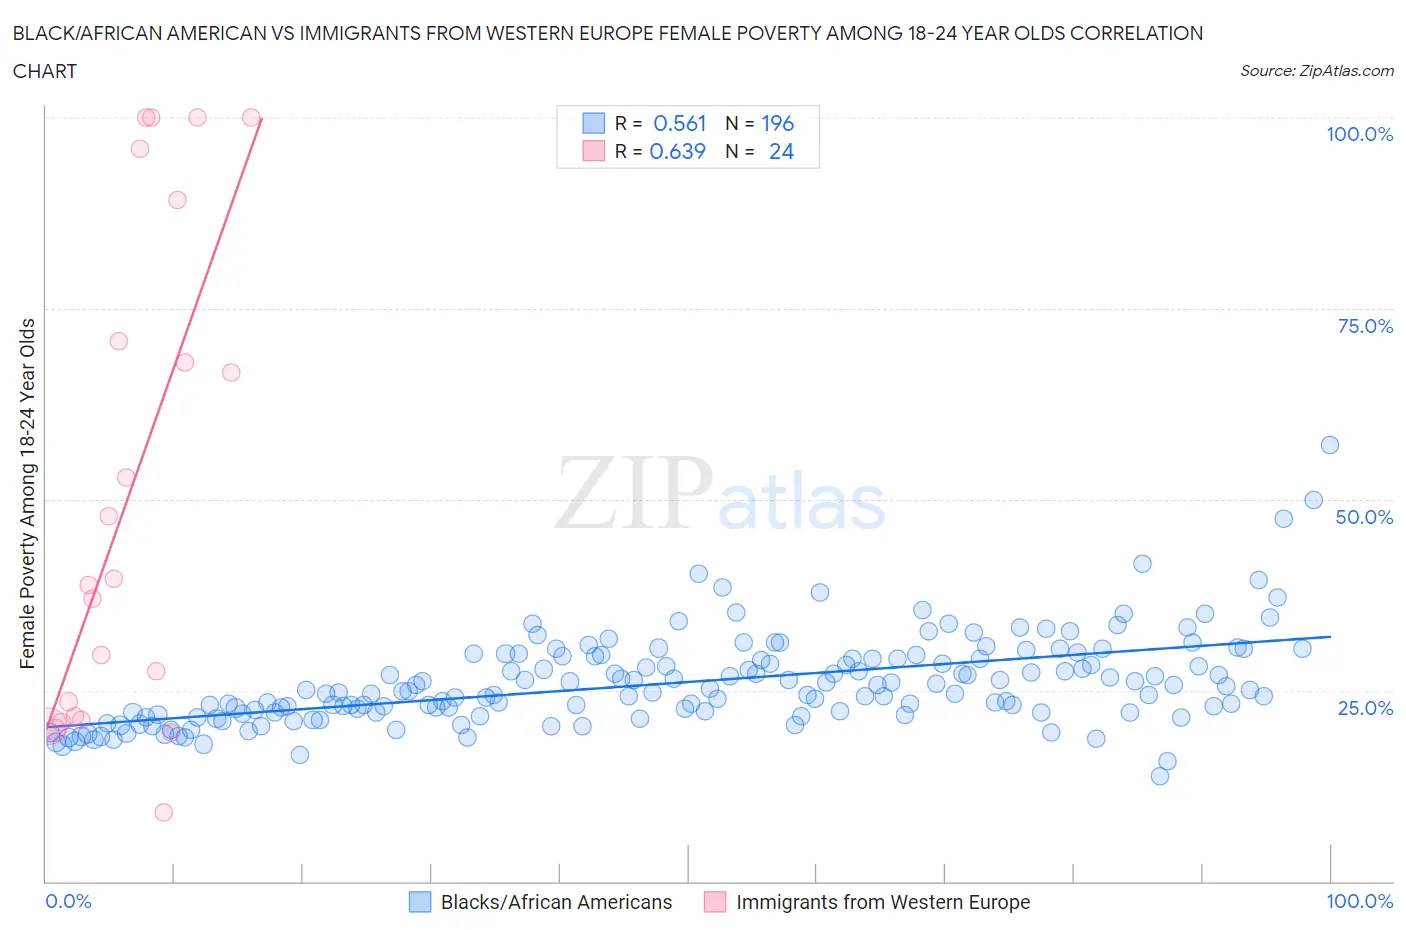
Black/African American vs Immigrants from Western Europe Female Poverty Among 18-24 Year Olds Correlation Chart
The statistical analysis conducted on geographies consisting of 536,191,091 people shows a substantial positive correlation between the proportion of Blacks/African Americans and poverty level among females between the ages 18 and 24 in the United States with a correlation coefficient (R) of 0.561 and weighted average of 24.3%. Similarly, the statistical analysis conducted on geographies consisting of 474,599,348 people shows a significant positive correlation between the proportion of Immigrants from Western Europe and poverty level among females between the ages 18 and 24 in the United States with a correlation coefficient (R) of 0.639 and weighted average of 20.6%, a difference of 18.2%.
Female Poverty Among 18-24 Year Olds Correlation Summary
| Measurement | Black/African American | Immigrants from Western Europe |
| Minimum | 13.7% | 8.9% |
| Maximum | 57.1% | 100.0% |
| Range | 43.4% | 91.1% |
| Mean | 26.0% | 50.8% |
| Median | 24.8% | 39.1% |
| Interquartile 25% (IQ1) | 22.0% | 21.3% |
| Interquartile 75% (IQ3) | 29.2% | 79.9% |
| Interquartile Range (IQR) | 7.2% | 58.6% |
| Standard Deviation (Sample) | 6.0% | 32.0% |
| Standard Deviation (Population) | 6.0% | 31.4% |
Similar Demographics by Female Poverty Among 18-24 Year Olds
Demographics Similar to Blacks/African Americans by Female Poverty Among 18-24 Year Olds
In terms of female poverty among 18-24 year olds, the demographic groups most similar to Blacks/African Americans are Choctaw (24.3%, a difference of 0.20%), Alsatian (24.4%, a difference of 0.31%), Creek (24.2%, a difference of 0.36%), Osage (24.5%, a difference of 0.60%), and Chickasaw (24.5%, a difference of 0.69%).
| Demographics | Rating | Rank | Female Poverty Among 18-24 Year Olds |
| Immigrants | Sudan | 0.0 /100 | #308 | Tragic 23.5% |
| Blackfeet | 0.0 /100 | #309 | Tragic 23.6% |
| Comanche | 0.0 /100 | #310 | Tragic 23.6% |
| Potawatomi | 0.0 /100 | #311 | Tragic 23.7% |
| Yuman | 0.0 /100 | #312 | Tragic 24.0% |
| Creek | 0.0 /100 | #313 | Tragic 24.2% |
| Choctaw | 0.0 /100 | #314 | Tragic 24.3% |
| Blacks/African Americans | 0.0 /100 | #315 | Tragic 24.3% |
| Alsatians | 0.0 /100 | #316 | Tragic 24.4% |
| Osage | 0.0 /100 | #317 | Tragic 24.5% |
| Chickasaw | 0.0 /100 | #318 | Tragic 24.5% |
| Dutch West Indians | 0.0 /100 | #319 | Tragic 24.5% |
| Immigrants | Congo | 0.0 /100 | #320 | Tragic 24.6% |
| Immigrants | Zaire | 0.0 /100 | #321 | Tragic 25.1% |
| Somalis | 0.0 /100 | #322 | Tragic 25.1% |
Demographics Similar to Immigrants from Western Europe by Female Poverty Among 18-24 Year Olds
In terms of female poverty among 18-24 year olds, the demographic groups most similar to Immigrants from Western Europe are Immigrants from Ghana (20.5%, a difference of 0.080%), Arab (20.5%, a difference of 0.19%), Liberian (20.6%, a difference of 0.21%), Northern European (20.6%, a difference of 0.21%), and Dutch (20.5%, a difference of 0.22%).
| Demographics | Rating | Rank | Female Poverty Among 18-24 Year Olds |
| Immigrants | Netherlands | 17.0 /100 | #204 | Poor 20.5% |
| English | 16.7 /100 | #205 | Poor 20.5% |
| Hispanics or Latinos | 16.6 /100 | #206 | Poor 20.5% |
| Spaniards | 16.3 /100 | #207 | Poor 20.5% |
| Dutch | 15.9 /100 | #208 | Poor 20.5% |
| Arabs | 15.5 /100 | #209 | Poor 20.5% |
| Immigrants | Ghana | 14.3 /100 | #210 | Poor 20.5% |
| Immigrants | Western Europe | 13.5 /100 | #211 | Poor 20.6% |
| Liberians | 11.6 /100 | #212 | Poor 20.6% |
| Northern Europeans | 11.6 /100 | #213 | Poor 20.6% |
| Immigrants | South Africa | 10.7 /100 | #214 | Poor 20.6% |
| Spanish | 10.4 /100 | #215 | Poor 20.6% |
| Immigrants | Western Africa | 10.2 /100 | #216 | Poor 20.6% |
| Immigrants | Laos | 9.7 /100 | #217 | Tragic 20.6% |
| Immigrants | Nepal | 9.6 /100 | #218 | Tragic 20.7% |