Blackfeet vs Brazilian Male Poverty
COMPARE
Blackfeet
Brazilian
Male Poverty
Male Poverty Comparison
Blackfeet
Brazilians
14.0%
MALE POVERTY
0.0/ 100
METRIC RATING
298th/ 347
METRIC RANK
10.8%
MALE POVERTY
82.7/ 100
METRIC RATING
135th/ 347
METRIC RANK
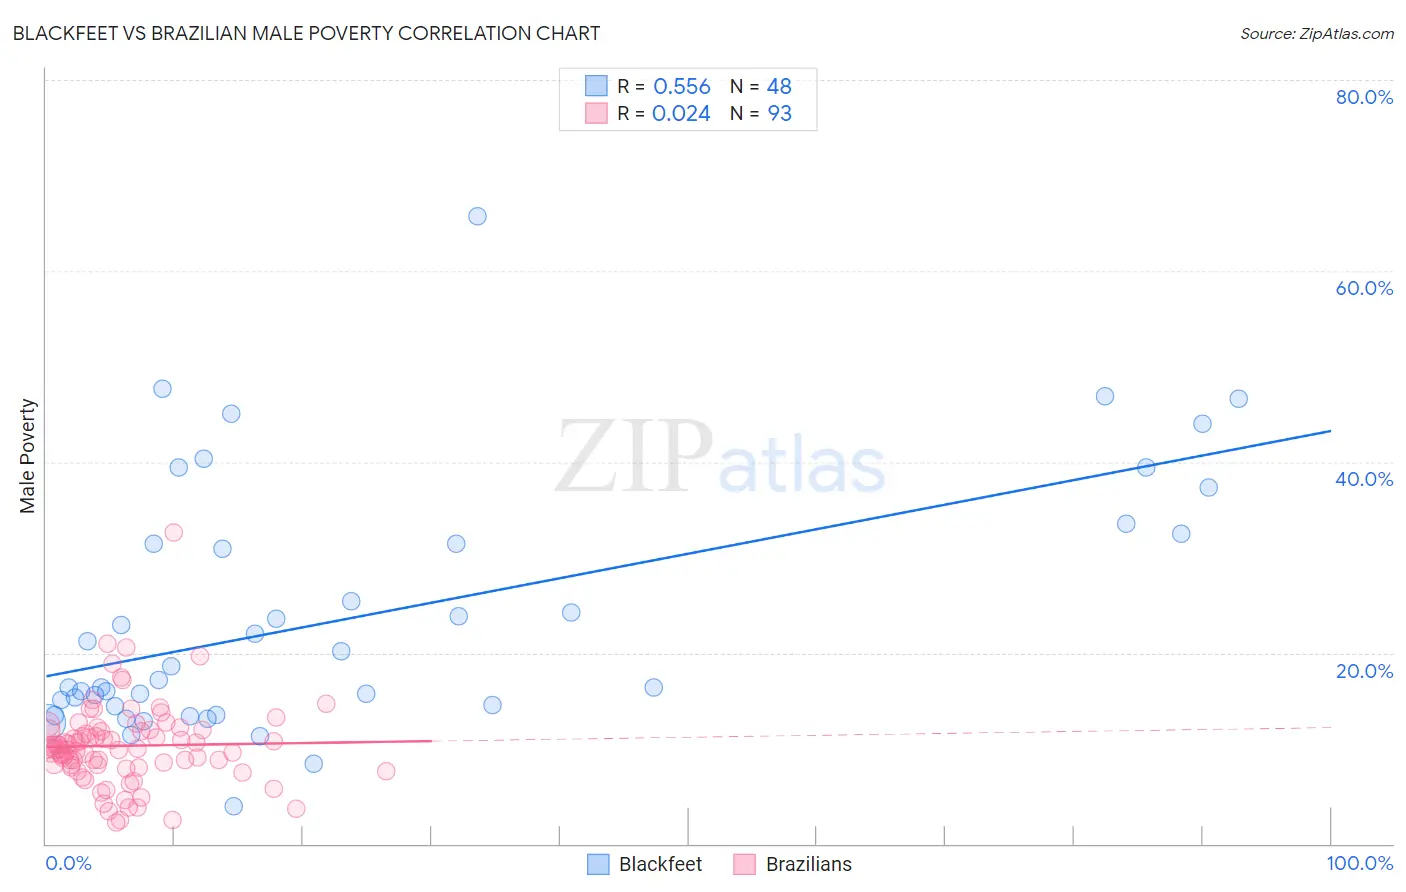
Blackfeet vs Brazilian Male Poverty Correlation Chart
The statistical analysis conducted on geographies consisting of 309,436,017 people shows a substantial positive correlation between the proportion of Blackfeet and poverty level among males in the United States with a correlation coefficient (R) of 0.556 and weighted average of 14.0%. Similarly, the statistical analysis conducted on geographies consisting of 323,645,938 people shows no correlation between the proportion of Brazilians and poverty level among males in the United States with a correlation coefficient (R) of 0.024 and weighted average of 10.8%, a difference of 30.1%.
Male Poverty Correlation Summary
| Measurement | Blackfeet | Brazilian |
| Minimum | 3.9% | 2.2% |
| Maximum | 65.7% | 32.6% |
| Range | 61.8% | 30.4% |
| Mean | 23.9% | 10.3% |
| Median | 17.9% | 10.0% |
| Interquartile 25% (IQ1) | 14.4% | 8.1% |
| Interquartile 75% (IQ3) | 31.9% | 11.9% |
| Interquartile Range (IQR) | 17.5% | 3.8% |
| Standard Deviation (Sample) | 13.2% | 4.4% |
| Standard Deviation (Population) | 13.0% | 4.4% |
Similar Demographics by Male Poverty
Demographics Similar to Blackfeet by Male Poverty
In terms of male poverty, the demographic groups most similar to Blackfeet are Inupiat (14.0%, a difference of 0.030%), Immigrants from Guatemala (14.0%, a difference of 0.10%), Immigrants from Mexico (14.0%, a difference of 0.22%), Immigrants from Senegal (14.0%, a difference of 0.29%), and Immigrants from Caribbean (14.0%, a difference of 0.34%).
| Demographics | Rating | Rank | Male Poverty |
| Vietnamese | 0.0 /100 | #291 | Tragic 13.8% |
| Indonesians | 0.0 /100 | #292 | Tragic 13.8% |
| Immigrants | Belize | 0.0 /100 | #293 | Tragic 13.8% |
| Hispanics or Latinos | 0.0 /100 | #294 | Tragic 13.9% |
| Immigrants | Central America | 0.0 /100 | #295 | Tragic 13.9% |
| Cajuns | 0.0 /100 | #296 | Tragic 13.9% |
| Inupiat | 0.0 /100 | #297 | Tragic 14.0% |
| Blackfeet | 0.0 /100 | #298 | Tragic 14.0% |
| Immigrants | Guatemala | 0.0 /100 | #299 | Tragic 14.0% |
| Immigrants | Mexico | 0.0 /100 | #300 | Tragic 14.0% |
| Immigrants | Senegal | 0.0 /100 | #301 | Tragic 14.0% |
| Immigrants | Caribbean | 0.0 /100 | #302 | Tragic 14.0% |
| Bahamians | 0.0 /100 | #303 | Tragic 14.1% |
| Senegalese | 0.0 /100 | #304 | Tragic 14.1% |
| Immigrants | Bangladesh | 0.0 /100 | #305 | Tragic 14.1% |
Demographics Similar to Brazilians by Male Poverty
In terms of male poverty, the demographic groups most similar to Brazilians are New Zealander (10.8%, a difference of 0.040%), Pakistani (10.8%, a difference of 0.050%), Immigrants from Vietnam (10.8%, a difference of 0.060%), Immigrants from Belarus (10.7%, a difference of 0.11%), and Chilean (10.7%, a difference of 0.22%).
| Demographics | Rating | Rank | Male Poverty |
| Immigrants | Western Europe | 84.2 /100 | #128 | Excellent 10.7% |
| Immigrants | Peru | 84.1 /100 | #129 | Excellent 10.7% |
| Chileans | 83.9 /100 | #130 | Excellent 10.7% |
| Immigrants | Belarus | 83.3 /100 | #131 | Excellent 10.7% |
| Immigrants | Vietnam | 83.0 /100 | #132 | Excellent 10.8% |
| Pakistanis | 83.0 /100 | #133 | Excellent 10.8% |
| New Zealanders | 82.9 /100 | #134 | Excellent 10.8% |
| Brazilians | 82.7 /100 | #135 | Excellent 10.8% |
| Immigrants | Israel | 80.9 /100 | #136 | Excellent 10.8% |
| Immigrants | Switzerland | 79.2 /100 | #137 | Good 10.8% |
| Yugoslavians | 78.2 /100 | #138 | Good 10.8% |
| Immigrants | Jordan | 77.5 /100 | #139 | Good 10.8% |
| Tlingit-Haida | 76.1 /100 | #140 | Good 10.9% |
| Immigrants | France | 75.8 /100 | #141 | Good 10.9% |
| Basques | 74.6 /100 | #142 | Good 10.9% |