Blackfeet vs Serbian Male Poverty
COMPARE
Blackfeet
Serbian
Male Poverty
Male Poverty Comparison
Blackfeet
Serbians
14.0%
MALE POVERTY
0.0/ 100
METRIC RATING
298th/ 347
METRIC RANK
10.2%
MALE POVERTY
97.5/ 100
METRIC RATING
66th/ 347
METRIC RANK
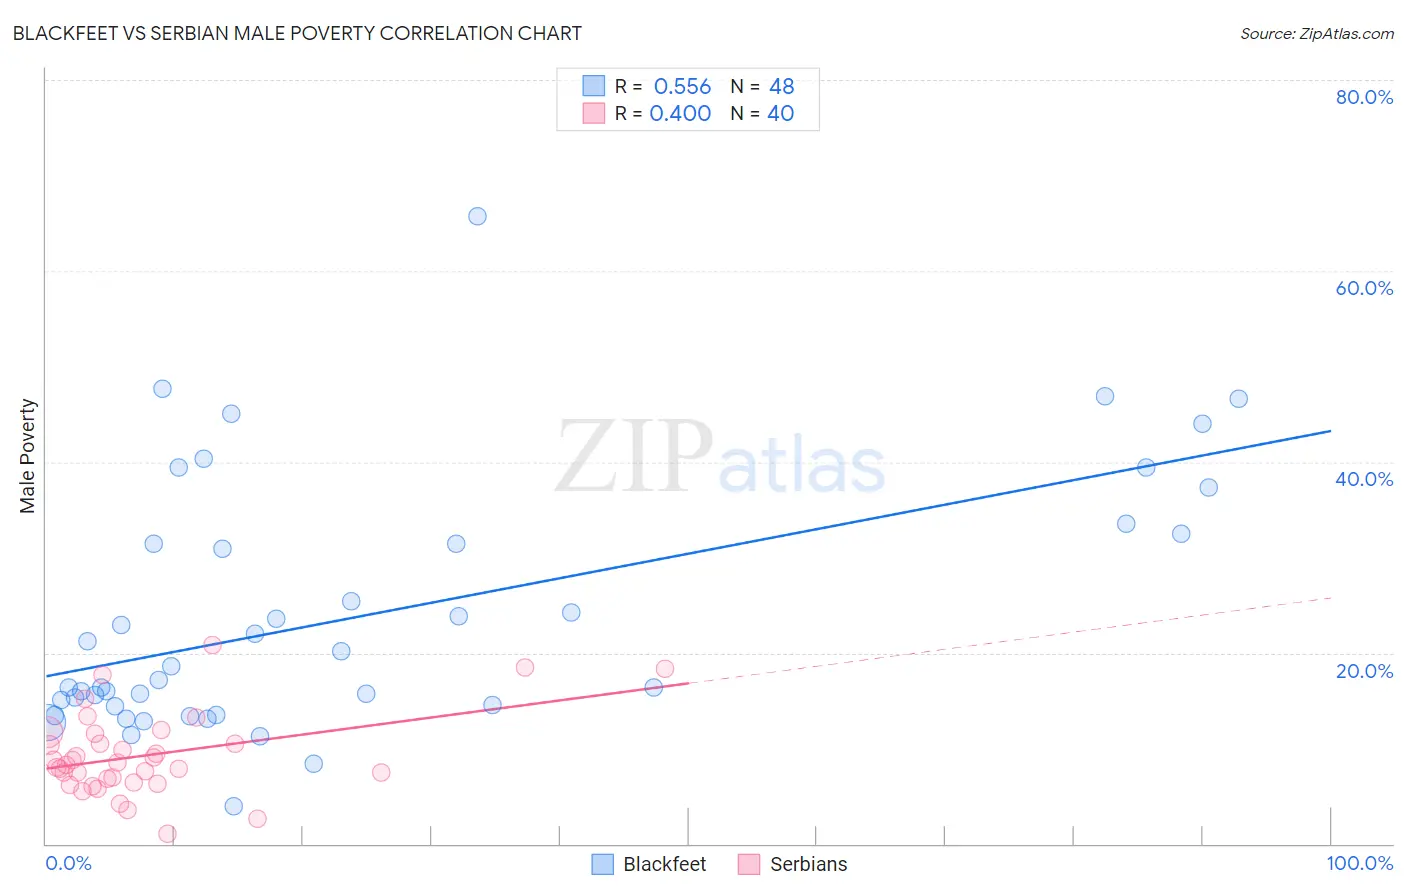
Blackfeet vs Serbian Male Poverty Correlation Chart
The statistical analysis conducted on geographies consisting of 309,436,017 people shows a substantial positive correlation between the proportion of Blackfeet and poverty level among males in the United States with a correlation coefficient (R) of 0.556 and weighted average of 14.0%. Similarly, the statistical analysis conducted on geographies consisting of 267,465,606 people shows a mild positive correlation between the proportion of Serbians and poverty level among males in the United States with a correlation coefficient (R) of 0.400 and weighted average of 10.2%, a difference of 37.4%.
Male Poverty Correlation Summary
| Measurement | Blackfeet | Serbian |
| Minimum | 3.9% | 1.0% |
| Maximum | 65.7% | 20.8% |
| Range | 61.8% | 19.8% |
| Mean | 23.9% | 9.3% |
| Median | 17.9% | 8.4% |
| Interquartile 25% (IQ1) | 14.4% | 6.6% |
| Interquartile 75% (IQ3) | 31.9% | 11.0% |
| Interquartile Range (IQR) | 17.5% | 4.4% |
| Standard Deviation (Sample) | 13.2% | 4.3% |
| Standard Deviation (Population) | 13.0% | 4.3% |
Similar Demographics by Male Poverty
Demographics Similar to Blackfeet by Male Poverty
In terms of male poverty, the demographic groups most similar to Blackfeet are Inupiat (14.0%, a difference of 0.030%), Immigrants from Guatemala (14.0%, a difference of 0.10%), Immigrants from Mexico (14.0%, a difference of 0.22%), Immigrants from Senegal (14.0%, a difference of 0.29%), and Immigrants from Caribbean (14.0%, a difference of 0.34%).
| Demographics | Rating | Rank | Male Poverty |
| Vietnamese | 0.0 /100 | #291 | Tragic 13.8% |
| Indonesians | 0.0 /100 | #292 | Tragic 13.8% |
| Immigrants | Belize | 0.0 /100 | #293 | Tragic 13.8% |
| Hispanics or Latinos | 0.0 /100 | #294 | Tragic 13.9% |
| Immigrants | Central America | 0.0 /100 | #295 | Tragic 13.9% |
| Cajuns | 0.0 /100 | #296 | Tragic 13.9% |
| Inupiat | 0.0 /100 | #297 | Tragic 14.0% |
| Blackfeet | 0.0 /100 | #298 | Tragic 14.0% |
| Immigrants | Guatemala | 0.0 /100 | #299 | Tragic 14.0% |
| Immigrants | Mexico | 0.0 /100 | #300 | Tragic 14.0% |
| Immigrants | Senegal | 0.0 /100 | #301 | Tragic 14.0% |
| Immigrants | Caribbean | 0.0 /100 | #302 | Tragic 14.0% |
| Bahamians | 0.0 /100 | #303 | Tragic 14.1% |
| Senegalese | 0.0 /100 | #304 | Tragic 14.1% |
| Immigrants | Bangladesh | 0.0 /100 | #305 | Tragic 14.1% |
Demographics Similar to Serbians by Male Poverty
In terms of male poverty, the demographic groups most similar to Serbians are Zimbabwean (10.2%, a difference of 0.010%), Swiss (10.2%, a difference of 0.080%), Immigrants from Netherlands (10.2%, a difference of 0.17%), Immigrants from Sri Lanka (10.2%, a difference of 0.22%), and Slovak (10.2%, a difference of 0.31%).
| Demographics | Rating | Rank | Male Poverty |
| Immigrants | Europe | 97.9 /100 | #59 | Exceptional 10.1% |
| Ukrainians | 97.9 /100 | #60 | Exceptional 10.1% |
| Austrians | 97.8 /100 | #61 | Exceptional 10.1% |
| Immigrants | Italy | 97.8 /100 | #62 | Exceptional 10.2% |
| Slovaks | 97.7 /100 | #63 | Exceptional 10.2% |
| Swiss | 97.5 /100 | #64 | Exceptional 10.2% |
| Zimbabweans | 97.5 /100 | #65 | Exceptional 10.2% |
| Serbians | 97.5 /100 | #66 | Exceptional 10.2% |
| Immigrants | Netherlands | 97.3 /100 | #67 | Exceptional 10.2% |
| Immigrants | Sri Lanka | 97.2 /100 | #68 | Exceptional 10.2% |
| Immigrants | Australia | 97.1 /100 | #69 | Exceptional 10.2% |
| Paraguayans | 97.1 /100 | #70 | Exceptional 10.2% |
| Europeans | 97.1 /100 | #71 | Exceptional 10.2% |
| Immigrants | Canada | 97.1 /100 | #72 | Exceptional 10.2% |
| Immigrants | Asia | 97.0 /100 | #73 | Exceptional 10.2% |