Italian vs Brazilian Male Poverty
COMPARE
Italian
Brazilian
Male Poverty
Male Poverty Comparison
Italians
Brazilians
9.6%
MALE POVERTY
99.7/ 100
METRIC RATING
23rd/ 347
METRIC RANK
10.8%
MALE POVERTY
82.7/ 100
METRIC RATING
135th/ 347
METRIC RANK
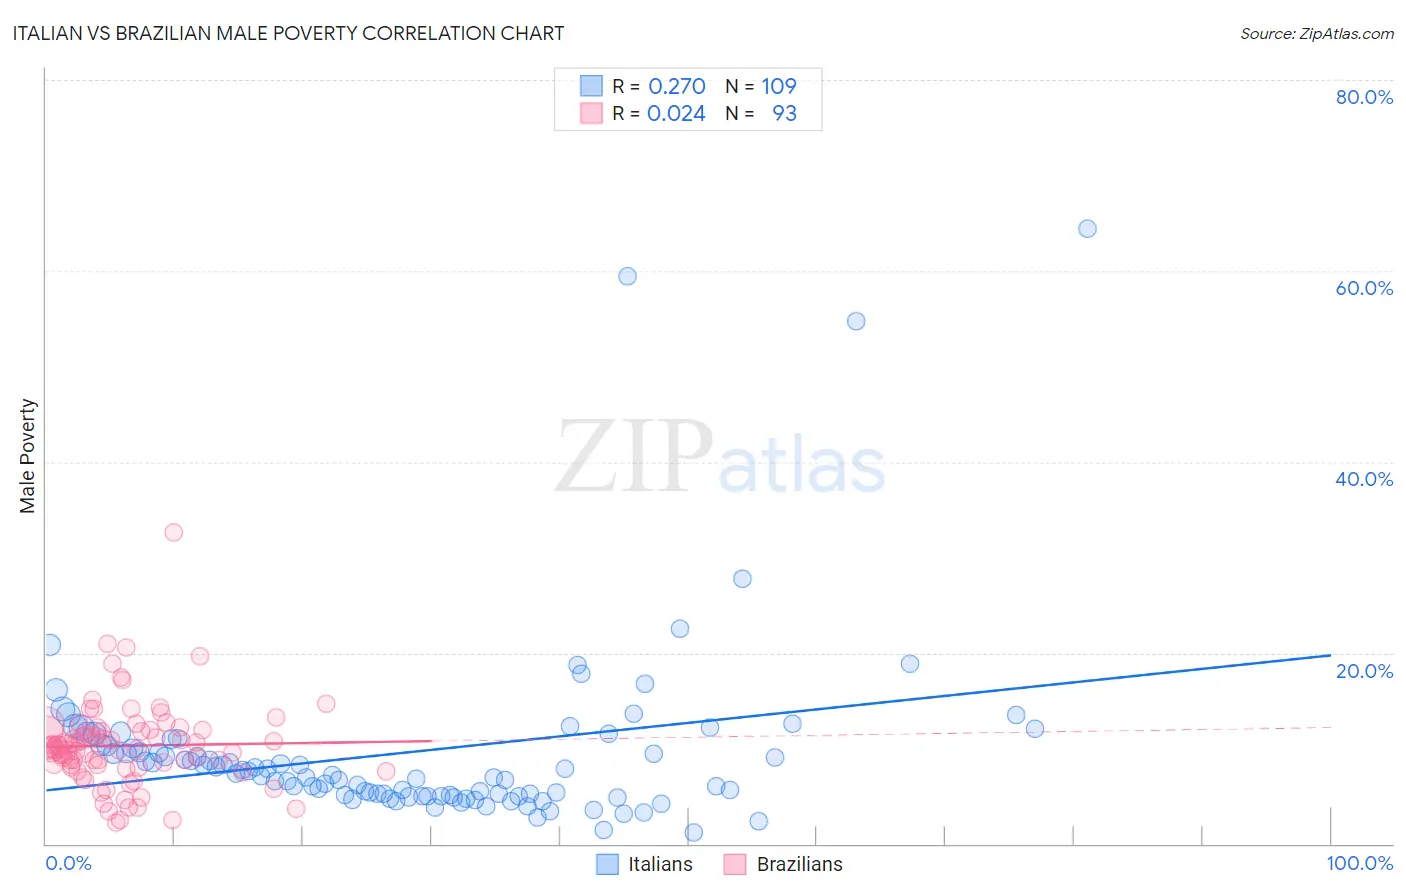
Italian vs Brazilian Male Poverty Correlation Chart
The statistical analysis conducted on geographies consisting of 573,221,501 people shows a weak positive correlation between the proportion of Italians and poverty level among males in the United States with a correlation coefficient (R) of 0.270 and weighted average of 9.6%. Similarly, the statistical analysis conducted on geographies consisting of 323,645,938 people shows no correlation between the proportion of Brazilians and poverty level among males in the United States with a correlation coefficient (R) of 0.024 and weighted average of 10.8%, a difference of 11.8%.
Male Poverty Correlation Summary
| Measurement | Italian | Brazilian |
| Minimum | 1.2% | 2.2% |
| Maximum | 64.4% | 32.6% |
| Range | 63.1% | 30.4% |
| Mean | 9.6% | 10.3% |
| Median | 7.3% | 10.0% |
| Interquartile 25% (IQ1) | 5.1% | 8.1% |
| Interquartile 75% (IQ3) | 10.7% | 11.9% |
| Interquartile Range (IQR) | 5.6% | 3.8% |
| Standard Deviation (Sample) | 9.6% | 4.4% |
| Standard Deviation (Population) | 9.5% | 4.4% |
Similar Demographics by Male Poverty
Demographics Similar to Italians by Male Poverty
In terms of male poverty, the demographic groups most similar to Italians are Croatian (9.6%, a difference of 0.010%), Swedish (9.6%, a difference of 0.080%), Eastern European (9.6%, a difference of 0.22%), Immigrants from Scotland (9.6%, a difference of 0.26%), and Latvian (9.6%, a difference of 0.52%).
| Demographics | Rating | Rank | Male Poverty |
| Luxembourgers | 99.8 /100 | #16 | Exceptional 9.5% |
| Norwegians | 99.8 /100 | #17 | Exceptional 9.5% |
| Lithuanians | 99.8 /100 | #18 | Exceptional 9.5% |
| Immigrants | Hong Kong | 99.7 /100 | #19 | Exceptional 9.6% |
| Latvians | 99.7 /100 | #20 | Exceptional 9.6% |
| Immigrants | Scotland | 99.7 /100 | #21 | Exceptional 9.6% |
| Croatians | 99.7 /100 | #22 | Exceptional 9.6% |
| Italians | 99.7 /100 | #23 | Exceptional 9.6% |
| Swedes | 99.7 /100 | #24 | Exceptional 9.6% |
| Eastern Europeans | 99.6 /100 | #25 | Exceptional 9.6% |
| Burmese | 99.6 /100 | #26 | Exceptional 9.7% |
| Danes | 99.6 /100 | #27 | Exceptional 9.7% |
| Immigrants | Korea | 99.6 /100 | #28 | Exceptional 9.7% |
| Greeks | 99.6 /100 | #29 | Exceptional 9.7% |
| Poles | 99.5 /100 | #30 | Exceptional 9.7% |
Demographics Similar to Brazilians by Male Poverty
In terms of male poverty, the demographic groups most similar to Brazilians are New Zealander (10.8%, a difference of 0.040%), Pakistani (10.8%, a difference of 0.050%), Immigrants from Vietnam (10.8%, a difference of 0.060%), Immigrants from Belarus (10.7%, a difference of 0.11%), and Chilean (10.7%, a difference of 0.22%).
| Demographics | Rating | Rank | Male Poverty |
| Immigrants | Western Europe | 84.2 /100 | #128 | Excellent 10.7% |
| Immigrants | Peru | 84.1 /100 | #129 | Excellent 10.7% |
| Chileans | 83.9 /100 | #130 | Excellent 10.7% |
| Immigrants | Belarus | 83.3 /100 | #131 | Excellent 10.7% |
| Immigrants | Vietnam | 83.0 /100 | #132 | Excellent 10.8% |
| Pakistanis | 83.0 /100 | #133 | Excellent 10.8% |
| New Zealanders | 82.9 /100 | #134 | Excellent 10.8% |
| Brazilians | 82.7 /100 | #135 | Excellent 10.8% |
| Immigrants | Israel | 80.9 /100 | #136 | Excellent 10.8% |
| Immigrants | Switzerland | 79.2 /100 | #137 | Good 10.8% |
| Yugoslavians | 78.2 /100 | #138 | Good 10.8% |
| Immigrants | Jordan | 77.5 /100 | #139 | Good 10.8% |
| Tlingit-Haida | 76.1 /100 | #140 | Good 10.9% |
| Immigrants | France | 75.8 /100 | #141 | Good 10.9% |
| Basques | 74.6 /100 | #142 | Good 10.9% |