Immigrants from Belize vs Immigrants from Greece Family Poverty

COMPARE

Immigrants from Belize
Race
Ancestry
AfghanAfricanAlaska NativeAlaskan AthabascanAlbanianAleutAlsatianAmericanApacheArabArapahoArgentineanArmenianAssyrian/Chaldean/SyriacAustralianAustrianBahamianBangladeshiBarbadianBasqueBelgianBelizeanBermudanBhutaneseBlackfeetBolivianBrazilianBritishBritish West IndianBulgarianBurmeseCajunCambodianCanadianCape VerdeanCarpatho RusynCelticCentral AmericanCentral American IndianCherokeeCheyenneChickasawChileanChineseChippewaChoctawColombianColvilleComancheCosta RicanCreeCreekCroatianCrowCubanCypriotCzechCzechoslovakianDanishDelawareDominicanDutchDutch West IndianEastern EuropeanEcuadorianEgyptianEnglishEstonianEthiopianEuropeanFijianFilipinoFinnishFrenchFrench American IndianFrench CanadianGermanGerman RussianGhanaianGreekGuamanian/ChamorroGuatemalanGuyaneseHaitianHmongHonduranHopiHoumaHungarianIcelanderIndian (Asian)IndonesianInupiatIranianIraqiIrishIroquoisIsraeliItalianJamaicanJapaneseJordanianKenyanKiowaKoreanLaotianLatvianLebaneseLiberianLithuanianLumbeeLuxembourgerMacedonianMalaysianMalteseMarshalleseMenomineeMexicanMexican American IndianMongolianMoroccanNative HawaiianNavajoNepaleseNew ZealanderNicaraguanNigerianNorthern EuropeanNorwegianOkinawanOsageOttawaPaiutePakistaniPalestinianPanamanianParaguayanPennsylvania GermanPeruvianPimaPolishPortuguesePotawatomiPuebloPuerto RicanPuget Sound SalishRomanianRussianSalvadoranSamoanScandinavianScotch-IrishScottishSeminoleSenegaleseSerbianShoshoneSierra LeoneanSiouxSlavicSlovakSloveneSomaliSouth AfricanSouth AmericanSouth American IndianSoviet UnionSpaniardSpanishSpanish AmericanSpanish American IndianSri LankanSubsaharan AfricanSudaneseSwedishSwissSyrianTaiwaneseThaiTlingit-HaidaTohono O'OdhamTonganTrinidadian and TobagonianTsimshianTurkishU.S. Virgin IslanderUgandanUkrainianUruguayanUteVenezuelanVietnameseWelshWest IndianYakamaYaquiYugoslavianYumanYup'ikZimbabwean
Immigration
NonimmigrantsImmigrantsAfghanistanAfricaAlbaniaArgentinaArmeniaAsiaAustraliaAustriaBahamasBangladeshBarbadosBelarusBelgiumBelizeBoliviaBosnia and HerzegovinaBrazilBulgariaBurma/MyanmarCabo VerdeCambodiaCameroonCanadaCaribbeanCentral AmericaChileChinaColombiaCongoCosta RicaCroatiaCubaCzechoslovakiaDenmarkDominicaDominican RepublicEastern AfricaEastern AsiaEastern EuropeEcuadorEgyptEl SalvadorEnglandEritreaEthiopiaEuropeFijiFranceGermanyGhanaGrenadaGuatemalaGuyanaHaitiHondurasHong KongHungaryIndiaIndonesiaIranIraqIrelandIsraelItalyJamaicaJapanJordanKazakhstanKenyaKoreaKuwaitLaosLatin AmericaLatviaLebanonLiberiaLithuaniaMalaysiaMexicoMicronesiaMiddle AfricaMoldovaMoroccoNepalNetherlandsNicaraguaNigeriaNorth AmericaNorth MacedoniaNorthern AfricaNorthern EuropeNorwayOceaniaPakistanPanamaPeruPhilippinesPolandPortugalRomaniaRussiaSaudi ArabiaScotlandSenegalSerbiaSierra LeoneSingaporeSomaliaSouth AfricaSouth AmericaSouth Central AsiaSouth Eastern AsiaSouthern EuropeSpainSri LankaSt. Vincent and the GrenadinesSudanSwedenSwitzerlandSyriaTaiwanThailandTrinidad and TobagoTurkeyUgandaUkraineUruguayUzbekistanVenezuelaVietnamWest IndiesWestern AfricaWestern AsiaWestern EuropeYemenZaireZimbabweAzores
Immigrants from Greece
Race
Ancestry
AfghanAfricanAlaska NativeAlaskan AthabascanAlbanianAleutAlsatianAmericanApacheArabArapahoArgentineanArmenianAssyrian/Chaldean/SyriacAustralianAustrianBahamianBangladeshiBarbadianBasqueBelgianBelizeanBermudanBhutaneseBlackfeetBolivianBrazilianBritishBritish West IndianBulgarianBurmeseCajunCambodianCanadianCape VerdeanCarpatho RusynCelticCentral AmericanCentral American IndianCherokeeCheyenneChickasawChileanChineseChippewaChoctawColombianColvilleComancheCosta RicanCreeCreekCroatianCrowCubanCypriotCzechCzechoslovakianDanishDelawareDominicanDutchDutch West IndianEastern EuropeanEcuadorianEgyptianEnglishEstonianEthiopianEuropeanFijianFilipinoFinnishFrenchFrench American IndianFrench CanadianGermanGerman RussianGhanaianGreekGuamanian/ChamorroGuatemalanGuyaneseHaitianHmongHonduranHopiHoumaHungarianIcelanderIndian (Asian)IndonesianInupiatIranianIraqiIrishIroquoisIsraeliItalianJamaicanJapaneseJordanianKenyanKiowaKoreanLaotianLatvianLebaneseLiberianLithuanianLumbeeLuxembourgerMacedonianMalaysianMalteseMarshalleseMenomineeMexicanMexican American IndianMongolianMoroccanNative HawaiianNavajoNepaleseNew ZealanderNicaraguanNigerianNorthern EuropeanNorwegianOkinawanOsageOttawaPaiutePakistaniPalestinianPanamanianParaguayanPennsylvania GermanPeruvianPimaPolishPortuguesePotawatomiPuebloPuerto RicanPuget Sound SalishRomanianRussianSalvadoranSamoanScandinavianScotch-IrishScottishSeminoleSenegaleseSerbianShoshoneSierra LeoneanSiouxSlavicSlovakSloveneSomaliSouth AfricanSouth AmericanSouth American IndianSoviet UnionSpaniardSpanishSpanish AmericanSpanish American IndianSri LankanSubsaharan AfricanSudaneseSwedishSwissSyrianTaiwaneseThaiTlingit-HaidaTohono O'OdhamTonganTrinidadian and TobagonianTsimshianTurkishU.S. Virgin IslanderUgandanUkrainianUruguayanUteVenezuelanVietnameseWelshWest IndianYakamaYaquiYugoslavianYumanYup'ikZimbabwean
Immigration
NonimmigrantsImmigrantsAfghanistanAfricaAlbaniaArgentinaArmeniaAsiaAustraliaAustriaBahamasBangladeshBarbadosBelarusBelgiumBoliviaBosnia and HerzegovinaBrazilBulgariaBurma/MyanmarCabo VerdeCambodiaCameroonCanadaCaribbeanCentral AmericaChileChinaColombiaCongoCosta RicaCroatiaCubaCzechoslovakiaDenmarkDominicaDominican RepublicEastern AfricaEastern AsiaEastern EuropeEcuadorEgyptEl SalvadorEnglandEritreaEthiopiaEuropeFijiFranceGermanyGhanaGreeceGrenadaGuatemalaGuyanaHaitiHondurasHong KongHungaryIndiaIndonesiaIranIraqIrelandIsraelItalyJamaicaJapanJordanKazakhstanKenyaKoreaKuwaitLaosLatin AmericaLatviaLebanonLiberiaLithuaniaMalaysiaMexicoMicronesiaMiddle AfricaMoldovaMoroccoNepalNetherlandsNicaraguaNigeriaNorth AmericaNorth MacedoniaNorthern AfricaNorthern EuropeNorwayOceaniaPakistanPanamaPeruPhilippinesPolandPortugalRomaniaRussiaSaudi ArabiaScotlandSenegalSerbiaSierra LeoneSingaporeSomaliaSouth AfricaSouth AmericaSouth Central AsiaSouth Eastern AsiaSouthern EuropeSpainSri LankaSt. Vincent and the GrenadinesSudanSwedenSwitzerlandSyriaTaiwanThailandTrinidad and TobagoTurkeyUgandaUkraineUruguayUzbekistanVenezuelaVietnamWest IndiesWestern AfricaWestern AsiaWestern EuropeYemenZaireZimbabweAzores
Family Poverty
Income
Poverty
Unemployment
Labor Participation
Family Structure
Vehicle Availability
Education Level
Disability

Family Poverty Comparison

Immigrants from Belize

Immigrants from Greece

Tragic
Exceptional
11.5%
FAMILY POVERTY
0.0/ 100
METRIC RATING
288th/ 347
METRIC RANK
7.7%
FAMILY POVERTY
98.7/ 100
METRIC RATING
60th/ 347
METRIC RANK

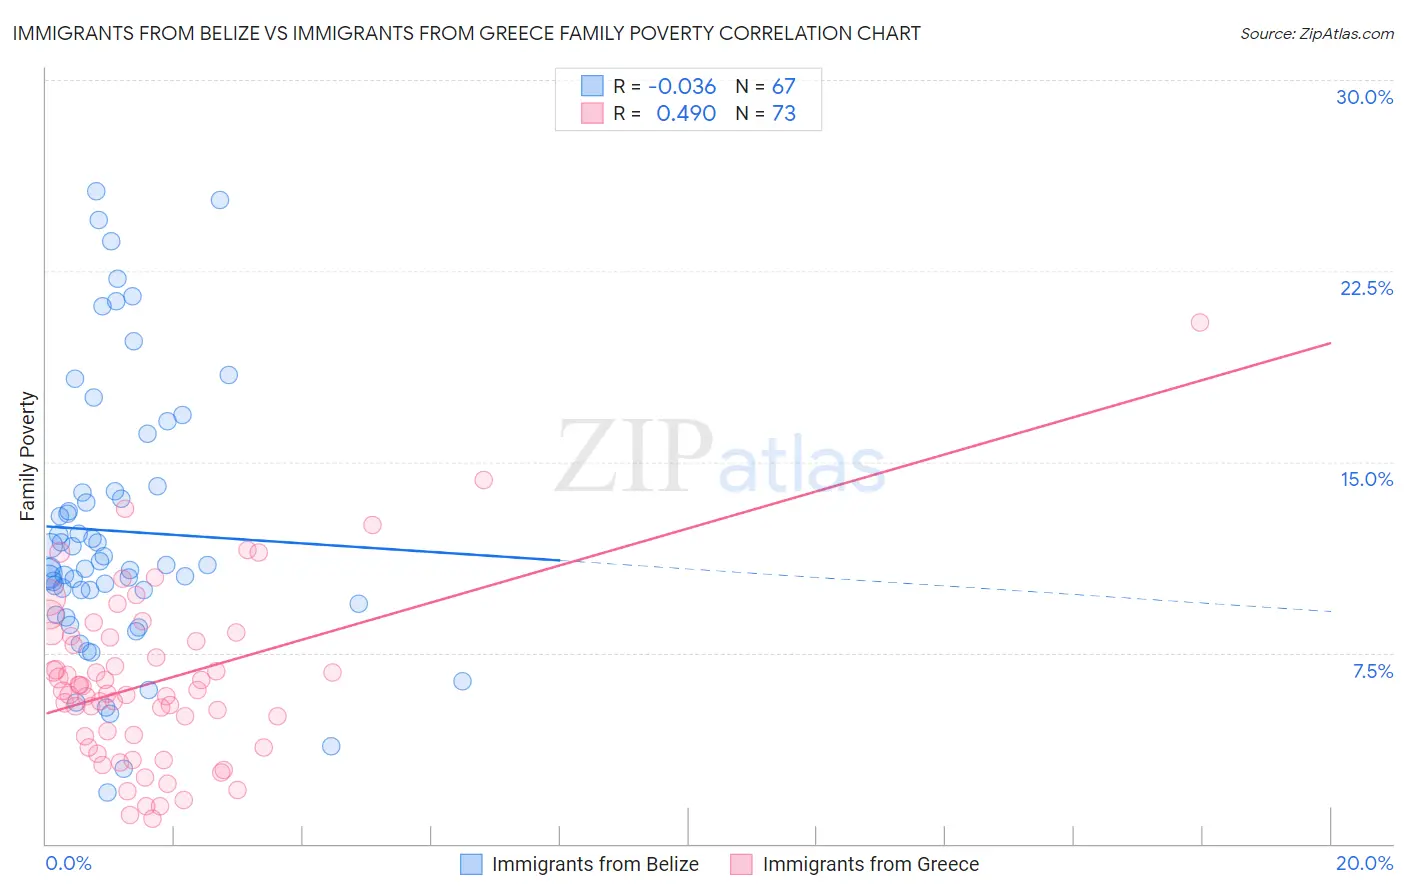
Immigrants from Belize vs Immigrants from Greece Family Poverty Correlation Chart

The statistical analysis conducted on geographies consisting of 130,249,442 people shows no correlation between the proportion of Immigrants from Belize and poverty level among families in the United States with a correlation coefficient (R) of -0.036 and weighted average of 11.5%. Similarly, the statistical analysis conducted on geographies consisting of 216,555,075 people shows a moderate positive correlation between the proportion of Immigrants from Greece and poverty level among families in the United States with a correlation coefficient (R) of 0.490 and weighted average of 7.7%, a difference of 49.0%.
Immigrants from Belize vs Immigrants from Greece Family Poverty

Family Poverty Correlation Summary

MeasurementImmigrants from BelizeImmigrants from Greece
Minimum2.0%0.99%
Maximum25.6%20.5%
Range23.6%19.5%
Mean12.3%6.4%
Median10.9%6.0%
Interquartile 25% (IQ1)9.4%4.0%
Interquartile 75% (IQ3)13.8%8.1%
Interquartile Range (IQR)4.4%4.1%
Standard Deviation (Sample)5.3%3.4%
Standard Deviation (Population)5.3%3.4%

Similar Demographics by Family Poverty

Demographics Similar to Immigrants from Belize by Family Poverty

In terms of family poverty, the demographic groups most similar to Immigrants from Belize are Immigrants from Barbados (11.5%, a difference of 0.050%), West Indian (11.5%, a difference of 0.060%), Haitian (11.5%, a difference of 0.12%), Vietnamese (11.5%, a difference of 0.19%), and Immigrants from Somalia (11.5%, a difference of 0.22%).
DemographicsRating | RankFamily Poverty
Immigrants | West Indies
0.0
/100
|
#281
Tragic
11.3%
Immigrants | Cuba
0.0
/100
|
#282
Tragic
11.3%
Indonesians
0.0
/100
|
#283
Tragic
11.3%
Yaqui
0.0
/100
|
#284
Tragic
11.3%
Barbadians
0.0
/100
|
#285
Tragic
11.3%
Senegalese
0.0
/100
|
#286
Tragic
11.5%
Vietnamese
0.0
/100
|
#287
Tragic
11.5%
Immigrants | Belize
0.0
/100
|
#288
Tragic
11.5%
Immigrants | Barbados
0.0
/100
|
#289
Tragic
11.5%
West Indians
0.0
/100
|
#290
Tragic
11.5%
Haitians
0.0
/100
|
#291
Tragic
11.5%
Immigrants | Somalia
0.0
/100
|
#292
Tragic
11.5%
Immigrants | Cabo Verde
0.0
/100
|
#293
Tragic
11.6%
Immigrants | St. Vincent and the Grenadines
0.0
/100
|
#294
Tragic
11.6%
Immigrants | Haiti
0.0
/100
|
#295
Tragic
11.6%

Demographics Similar to Immigrants from Greece by Family Poverty

In terms of family poverty, the demographic groups most similar to Immigrants from Greece are European (7.7%, a difference of 0.010%), Finnish (7.7%, a difference of 0.020%), Asian (7.7%, a difference of 0.050%), Immigrants from Serbia (7.7%, a difference of 0.14%), and Immigrants from Eastern Asia (7.7%, a difference of 0.18%).
DemographicsRating | RankFamily Poverty
Swiss
98.8
/100
|
#53
Exceptional
7.7%
Immigrants | Sweden
98.8
/100
|
#54
Exceptional
7.7%
Immigrants | Eastern Asia
98.7
/100
|
#55
Exceptional
7.7%
Immigrants | Serbia
98.7
/100
|
#56
Exceptional
7.7%
Asians
98.7
/100
|
#57
Exceptional
7.7%
Finns
98.7
/100
|
#58
Exceptional
7.7%
Europeans
98.7
/100
|
#59
Exceptional
7.7%
Immigrants | Greece
98.7
/100
|
#60
Exceptional
7.7%
Immigrants | Netherlands
98.6
/100
|
#61
Exceptional
7.7%
Macedonians
98.6
/100
|
#62
Exceptional
7.8%
Zimbabweans
98.4
/100
|
#63
Exceptional
7.8%
Koreans
98.3
/100
|
#64
Exceptional
7.8%
Immigrants | Bulgaria
98.3
/100
|
#65
Exceptional
7.8%
Dutch
98.3
/100
|
#66
Exceptional
7.8%
Northern Europeans
98.3
/100
|
#67
Exceptional
7.8%