Basque vs Russian 9th Grade
COMPARE
Basque
Russian
9th Grade
9th Grade Comparison
Basques
Russians
95.4%
9TH GRADE
94.1/ 100
METRIC RATING
129th/ 347
METRIC RANK
96.0%
9TH GRADE
99.9/ 100
METRIC RATING
47th/ 347
METRIC RANK
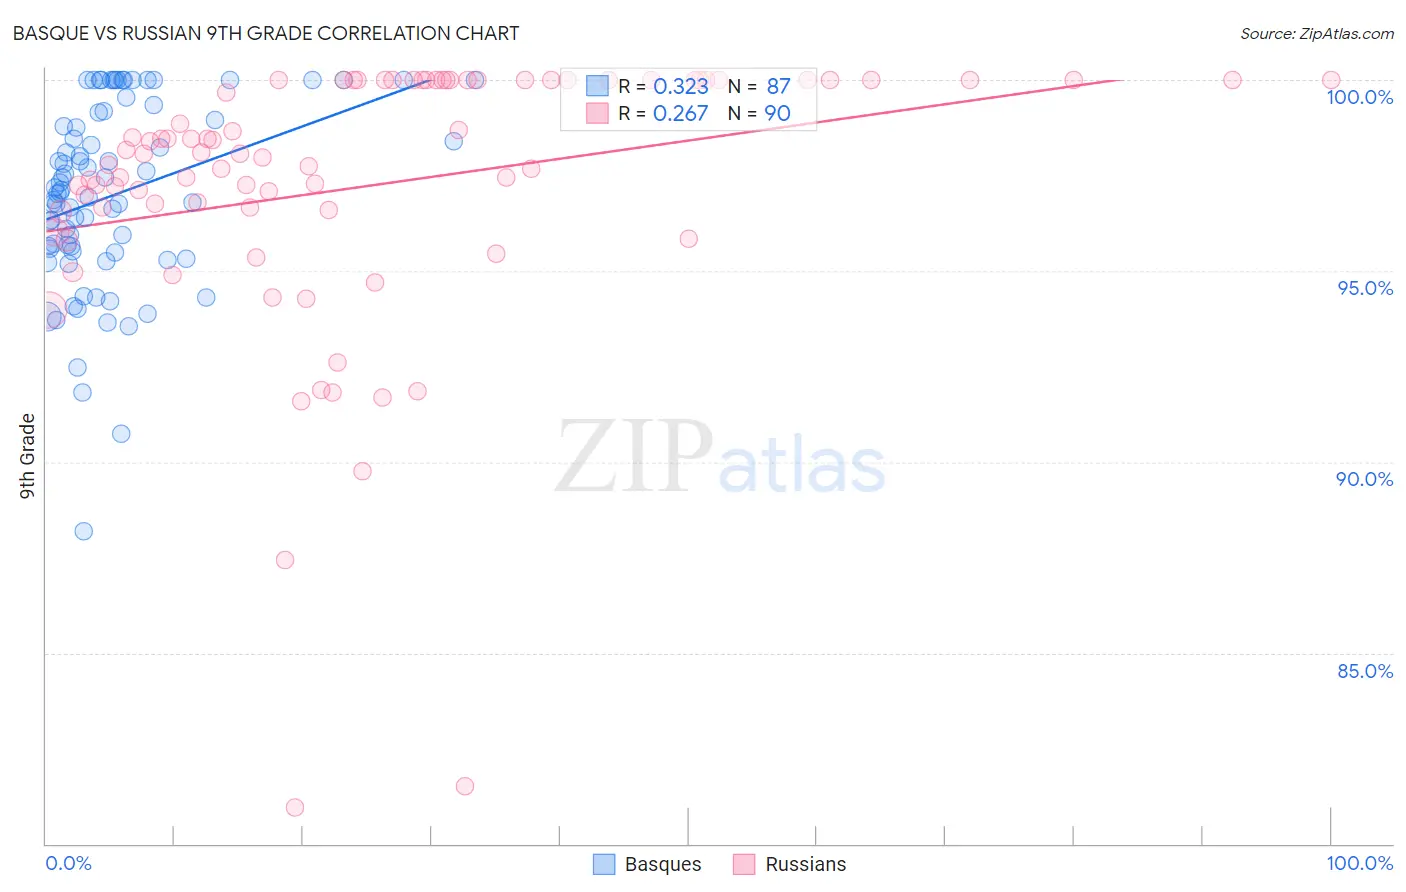
Basque vs Russian 9th Grade Correlation Chart
The statistical analysis conducted on geographies consisting of 165,777,136 people shows a mild positive correlation between the proportion of Basques and percentage of population with at least 9th grade education in the United States with a correlation coefficient (R) of 0.323 and weighted average of 95.4%. Similarly, the statistical analysis conducted on geographies consisting of 512,258,066 people shows a weak positive correlation between the proportion of Russians and percentage of population with at least 9th grade education in the United States with a correlation coefficient (R) of 0.267 and weighted average of 96.0%, a difference of 0.72%.
9th Grade Correlation Summary
| Measurement | Basque | Russian |
| Minimum | 88.2% | 81.0% |
| Maximum | 100.0% | 100.0% |
| Range | 11.8% | 19.0% |
| Mean | 97.0% | 97.2% |
| Median | 97.1% | 98.1% |
| Interquartile 25% (IQ1) | 95.5% | 96.6% |
| Interquartile 75% (IQ3) | 99.2% | 100.0% |
| Interquartile Range (IQR) | 3.6% | 3.4% |
| Standard Deviation (Sample) | 2.4% | 3.6% |
| Standard Deviation (Population) | 2.4% | 3.6% |
Similar Demographics by 9th Grade
Demographics Similar to Basques by 9th Grade
In terms of 9th grade, the demographic groups most similar to Basques are Immigrants from Hungary (95.4%, a difference of 0.0%), Immigrants from Serbia (95.4%, a difference of 0.010%), Palestinian (95.4%, a difference of 0.010%), Jordanian (95.3%, a difference of 0.020%), and Immigrants from South Central Asia (95.4%, a difference of 0.030%).
| Demographics | Rating | Rank | 9th Grade |
| Immigrants | Kuwait | 95.5 /100 | #122 | Exceptional 95.4% |
| Kiowa | 95.3 /100 | #123 | Exceptional 95.4% |
| Shoshone | 95.3 /100 | #124 | Exceptional 95.4% |
| Immigrants | South Central Asia | 95.1 /100 | #125 | Exceptional 95.4% |
| Immigrants | Serbia | 94.4 /100 | #126 | Exceptional 95.4% |
| Palestinians | 94.3 /100 | #127 | Exceptional 95.4% |
| Immigrants | Hungary | 94.2 /100 | #128 | Exceptional 95.4% |
| Basques | 94.1 /100 | #129 | Exceptional 95.4% |
| Jordanians | 93.5 /100 | #130 | Exceptional 95.3% |
| Immigrants | North Macedonia | 92.3 /100 | #131 | Exceptional 95.3% |
| Immigrants | Nonimmigrants | 92.0 /100 | #132 | Exceptional 95.3% |
| Israelis | 90.4 /100 | #133 | Exceptional 95.3% |
| Immigrants | Israel | 89.6 /100 | #134 | Excellent 95.3% |
| Immigrants | Belarus | 88.9 /100 | #135 | Excellent 95.2% |
| Immigrants | Iran | 88.3 /100 | #136 | Excellent 95.2% |
Demographics Similar to Russians by 9th Grade
In terms of 9th grade, the demographic groups most similar to Russians are Australian (96.0%, a difference of 0.0%), Crow (96.1%, a difference of 0.010%), Immigrants from India (96.1%, a difference of 0.010%), Greek (96.0%, a difference of 0.010%), and Alaska Native (96.1%, a difference of 0.020%).
| Demographics | Rating | Rank | 9th Grade |
| Slavs | 99.9 /100 | #40 | Exceptional 96.1% |
| Czechoslovakians | 99.9 /100 | #41 | Exceptional 96.1% |
| Chippewa | 99.9 /100 | #42 | Exceptional 96.1% |
| Iranians | 99.9 /100 | #43 | Exceptional 96.1% |
| Alaska Natives | 99.9 /100 | #44 | Exceptional 96.1% |
| Crow | 99.9 /100 | #45 | Exceptional 96.1% |
| Immigrants | India | 99.9 /100 | #46 | Exceptional 96.1% |
| Russians | 99.9 /100 | #47 | Exceptional 96.0% |
| Australians | 99.9 /100 | #48 | Exceptional 96.0% |
| Greeks | 99.9 /100 | #49 | Exceptional 96.0% |
| Celtics | 99.9 /100 | #50 | Exceptional 96.0% |
| Immigrants | Northern Europe | 99.9 /100 | #51 | Exceptional 96.0% |
| Serbians | 99.9 /100 | #52 | Exceptional 96.0% |
| Austrians | 99.8 /100 | #53 | Exceptional 96.0% |
| Immigrants | Canada | 99.8 /100 | #54 | Exceptional 96.0% |