Basque vs Kiowa Child Poverty Under the Age of 5
COMPARE
Basque
Kiowa
Child Poverty Under the Age of 5
Child Poverty Under the Age of 5 Comparison
Basques
Kiowa
16.0%
CHILD POVERTY UNDER THE AGE OF 5
93.4/ 100
METRIC RATING
117th/ 347
METRIC RANK
24.5%
CHILD POVERTY UNDER THE AGE OF 5
0.0/ 100
METRIC RATING
331st/ 347
METRIC RANK
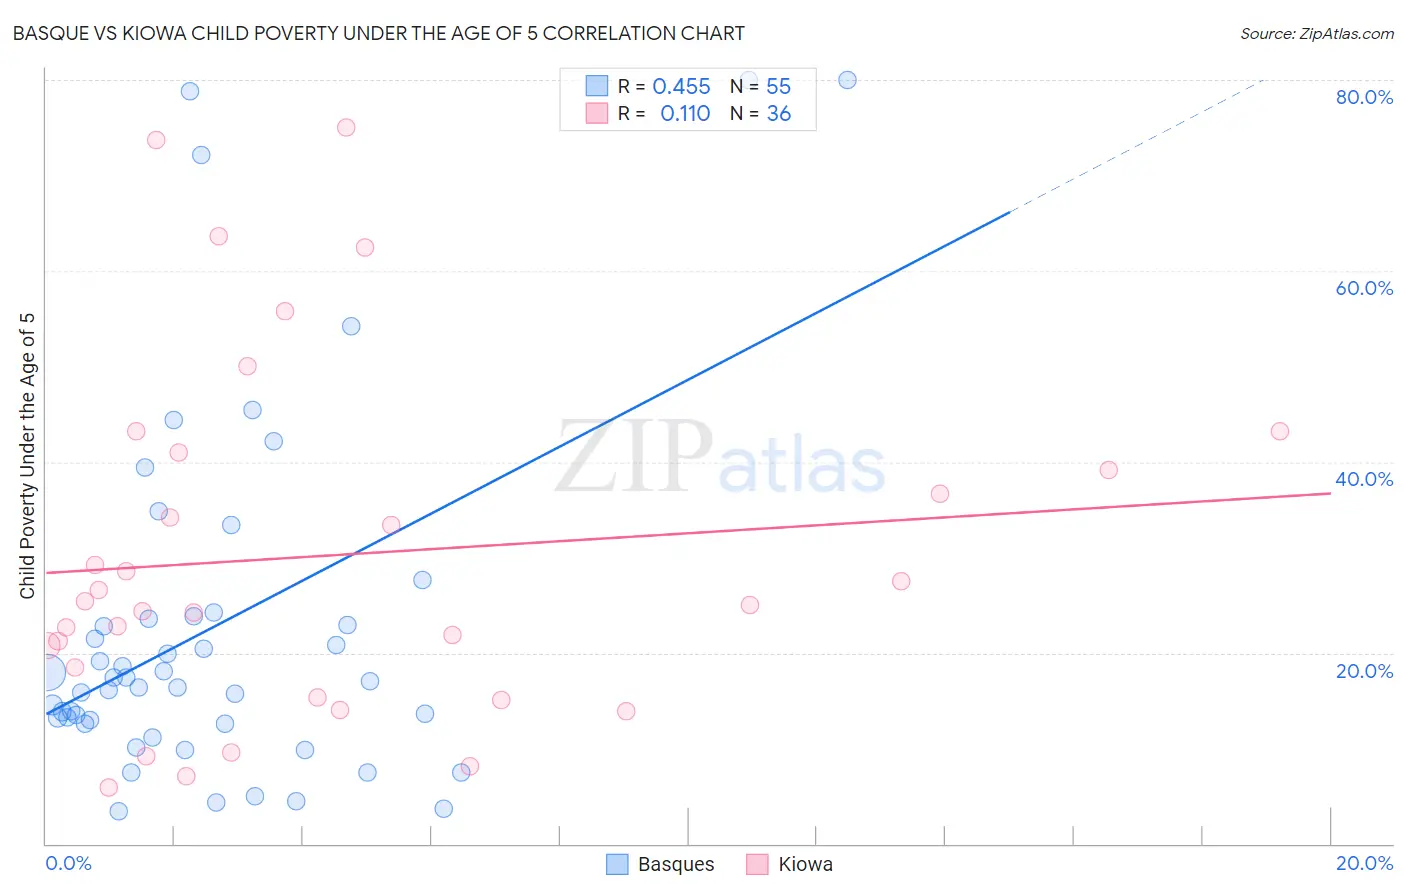
Basque vs Kiowa Child Poverty Under the Age of 5 Correlation Chart
The statistical analysis conducted on geographies consisting of 162,359,571 people shows a moderate positive correlation between the proportion of Basques and poverty level among children under the age of 5 in the United States with a correlation coefficient (R) of 0.455 and weighted average of 16.0%. Similarly, the statistical analysis conducted on geographies consisting of 55,875,823 people shows a poor positive correlation between the proportion of Kiowa and poverty level among children under the age of 5 in the United States with a correlation coefficient (R) of 0.110 and weighted average of 24.5%, a difference of 52.5%.
Child Poverty Under the Age of 5 Correlation Summary
| Measurement | Basque | Kiowa |
| Minimum | 3.4% | 5.8% |
| Maximum | 80.0% | 75.0% |
| Range | 76.6% | 69.2% |
| Mean | 22.8% | 30.2% |
| Median | 17.1% | 25.2% |
| Interquartile 25% (IQ1) | 12.6% | 16.9% |
| Interquartile 75% (IQ3) | 23.8% | 40.1% |
| Interquartile Range (IQR) | 11.2% | 23.2% |
| Standard Deviation (Sample) | 19.0% | 18.4% |
| Standard Deviation (Population) | 18.8% | 18.1% |
Similar Demographics by Child Poverty Under the Age of 5
Demographics Similar to Basques by Child Poverty Under the Age of 5
In terms of child poverty under the age of 5, the demographic groups most similar to Basques are Immigrants from Denmark (16.0%, a difference of 0.0%), Immigrants from Austria (16.0%, a difference of 0.020%), Immigrants from Jordan (16.1%, a difference of 0.11%), Albanian (16.0%, a difference of 0.18%), and Immigrants from Kuwait (16.0%, a difference of 0.21%).
| Demographics | Rating | Rank | Child Poverty Under the Age of 5 |
| Romanians | 94.3 /100 | #110 | Exceptional 16.0% |
| Pakistanis | 94.2 /100 | #111 | Exceptional 16.0% |
| Peruvians | 94.1 /100 | #112 | Exceptional 16.0% |
| Puget Sound Salish | 94.1 /100 | #113 | Exceptional 16.0% |
| Immigrants | Kuwait | 93.9 /100 | #114 | Exceptional 16.0% |
| Albanians | 93.8 /100 | #115 | Exceptional 16.0% |
| Immigrants | Austria | 93.5 /100 | #116 | Exceptional 16.0% |
| Basques | 93.4 /100 | #117 | Exceptional 16.0% |
| Immigrants | Denmark | 93.4 /100 | #118 | Exceptional 16.0% |
| Immigrants | Jordan | 93.2 /100 | #119 | Exceptional 16.1% |
| Immigrants | Peru | 92.6 /100 | #120 | Exceptional 16.1% |
| Mongolians | 92.5 /100 | #121 | Exceptional 16.1% |
| Immigrants | Southern Europe | 92.0 /100 | #122 | Exceptional 16.1% |
| Austrians | 92.0 /100 | #123 | Exceptional 16.1% |
| Swiss | 92.0 /100 | #124 | Exceptional 16.1% |
Demographics Similar to Kiowa by Child Poverty Under the Age of 5
In terms of child poverty under the age of 5, the demographic groups most similar to Kiowa are Creek (24.2%, a difference of 1.0%), Cajun (24.1%, a difference of 1.5%), Immigrants from Dominican Republic (24.1%, a difference of 1.7%), Dominican (24.0%, a difference of 1.8%), and Apache (25.0%, a difference of 2.2%).
| Demographics | Rating | Rank | Child Poverty Under the Age of 5 |
| Paiute | 0.0 /100 | #324 | Tragic 23.8% |
| Immigrants | Congo | 0.0 /100 | #325 | Tragic 23.9% |
| Central American Indians | 0.0 /100 | #326 | Tragic 23.9% |
| Dominicans | 0.0 /100 | #327 | Tragic 24.0% |
| Immigrants | Dominican Republic | 0.0 /100 | #328 | Tragic 24.1% |
| Cajuns | 0.0 /100 | #329 | Tragic 24.1% |
| Creek | 0.0 /100 | #330 | Tragic 24.2% |
| Kiowa | 0.0 /100 | #331 | Tragic 24.5% |
| Apache | 0.0 /100 | #332 | Tragic 25.0% |
| Natives/Alaskans | 0.0 /100 | #333 | Tragic 25.6% |
| Blacks/African Americans | 0.0 /100 | #334 | Tragic 25.7% |
| Colville | 0.0 /100 | #335 | Tragic 25.7% |
| Sioux | 0.0 /100 | #336 | Tragic 26.9% |
| Pima | 0.0 /100 | #337 | Tragic 27.4% |
| Hopi | 0.0 /100 | #338 | Tragic 27.7% |