Basque vs Immigrants from the Azores 8th Grade
COMPARE
Basque
Immigrants from the Azores
8th Grade
8th Grade Comparison
Basques
Immigrants from the Azores
96.1%
8TH GRADE
91.5/ 100
METRIC RATING
135th/ 347
METRIC RANK
92.5%
8TH GRADE
0.0/ 100
METRIC RATING
327th/ 347
METRIC RANK
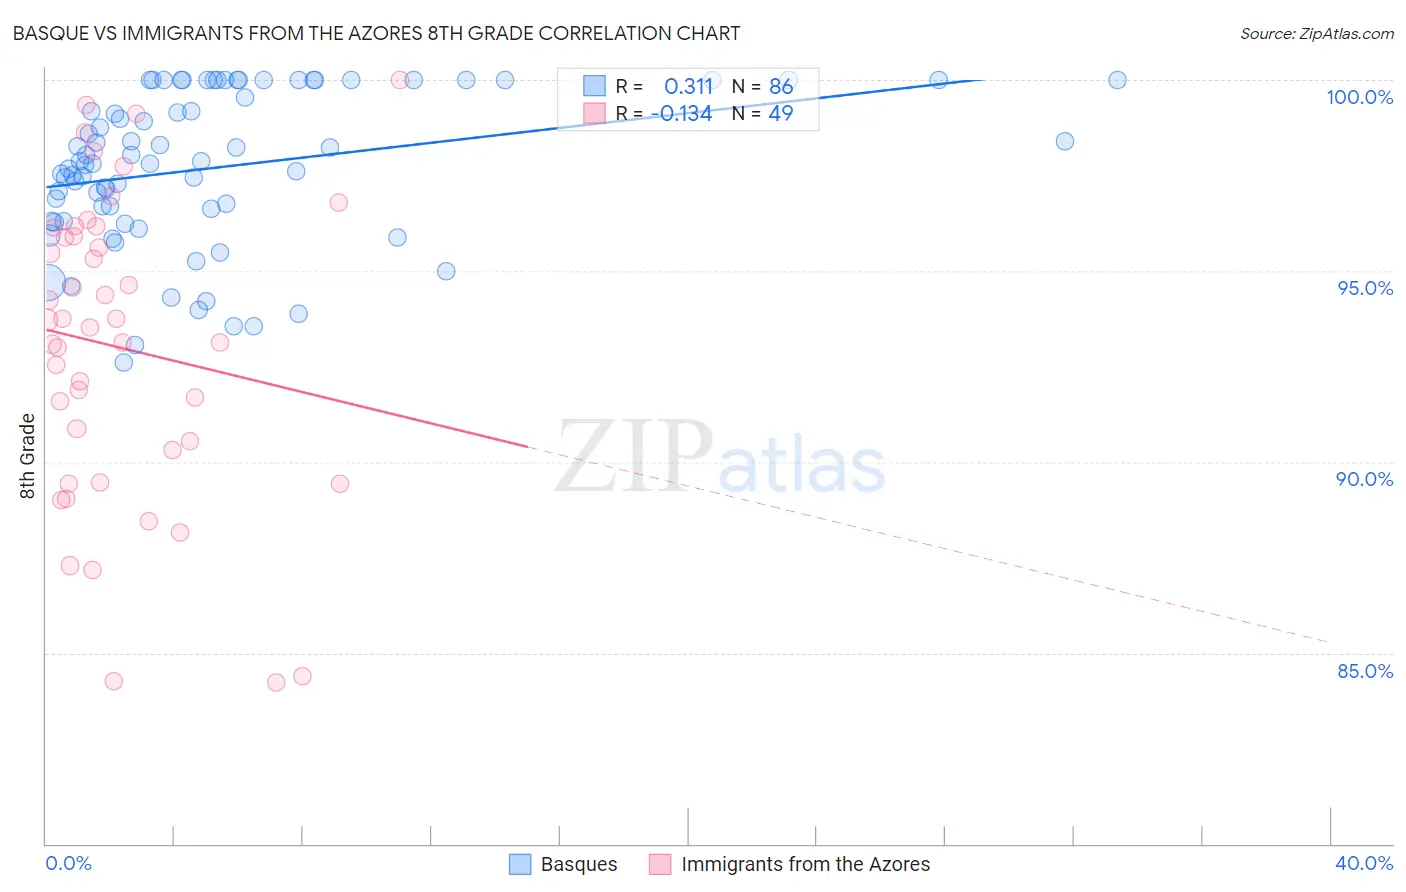
Basque vs Immigrants from the Azores 8th Grade Correlation Chart
The statistical analysis conducted on geographies consisting of 165,772,472 people shows a mild positive correlation between the proportion of Basques and percentage of population with at least 8th grade education in the United States with a correlation coefficient (R) of 0.311 and weighted average of 96.1%. Similarly, the statistical analysis conducted on geographies consisting of 46,257,310 people shows a poor negative correlation between the proportion of Immigrants from the Azores and percentage of population with at least 8th grade education in the United States with a correlation coefficient (R) of -0.134 and weighted average of 92.5%, a difference of 3.9%.
8th Grade Correlation Summary
| Measurement | Basque | Immigrants from the Azores |
| Minimum | 92.6% | 84.2% |
| Maximum | 100.0% | 100.0% |
| Range | 7.4% | 15.8% |
| Mean | 97.7% | 93.0% |
| Median | 97.8% | 93.5% |
| Interquartile 25% (IQ1) | 96.3% | 89.9% |
| Interquartile 75% (IQ3) | 100.0% | 96.0% |
| Interquartile Range (IQR) | 3.7% | 6.2% |
| Standard Deviation (Sample) | 2.0% | 4.0% |
| Standard Deviation (Population) | 2.0% | 3.9% |
Similar Demographics by 8th Grade
Demographics Similar to Basques by 8th Grade
In terms of 8th grade, the demographic groups most similar to Basques are Immigrants from Hungary (96.1%, a difference of 0.0%), Jordanian (96.1%, a difference of 0.0%), Immigrants from Kuwait (96.1%, a difference of 0.010%), Immigrants from Turkey (96.1%, a difference of 0.010%), and Pueblo (96.1%, a difference of 0.020%).
| Demographics | Rating | Rank | 8th Grade |
| Immigrants | Bosnia and Herzegovina | 93.9 /100 | #128 | Exceptional 96.2% |
| Cheyenne | 93.3 /100 | #129 | Exceptional 96.1% |
| Soviet Union | 92.6 /100 | #130 | Exceptional 96.1% |
| Pueblo | 92.3 /100 | #131 | Exceptional 96.1% |
| Immigrants | Kuwait | 92.2 /100 | #132 | Exceptional 96.1% |
| Immigrants | Turkey | 91.7 /100 | #133 | Exceptional 96.1% |
| Immigrants | Hungary | 91.5 /100 | #134 | Exceptional 96.1% |
| Basques | 91.5 /100 | #135 | Exceptional 96.1% |
| Jordanians | 91.3 /100 | #136 | Exceptional 96.1% |
| Cambodians | 90.6 /100 | #137 | Exceptional 96.1% |
| Burmese | 90.2 /100 | #138 | Exceptional 96.1% |
| Hmong | 89.7 /100 | #139 | Excellent 96.1% |
| Immigrants | South Central Asia | 89.4 /100 | #140 | Excellent 96.1% |
| Immigrants | Greece | 85.9 /100 | #141 | Excellent 96.0% |
| Immigrants | Eastern Europe | 85.4 /100 | #142 | Excellent 96.0% |
Demographics Similar to Immigrants from the Azores by 8th Grade
In terms of 8th grade, the demographic groups most similar to Immigrants from the Azores are Immigrants from Nicaragua (92.5%, a difference of 0.030%), Immigrants from Cabo Verde (92.4%, a difference of 0.090%), Immigrants from Armenia (92.3%, a difference of 0.18%), Honduran (92.3%, a difference of 0.19%), and Immigrants from Dominican Republic (92.3%, a difference of 0.20%).
| Demographics | Rating | Rank | 8th Grade |
| Immigrants | Fiji | 0.0 /100 | #320 | Tragic 93.2% |
| Belizeans | 0.0 /100 | #321 | Tragic 93.1% |
| Nicaraguans | 0.0 /100 | #322 | Tragic 93.0% |
| Immigrants | Belize | 0.0 /100 | #323 | Tragic 92.9% |
| Nepalese | 0.0 /100 | #324 | Tragic 92.8% |
| Dominicans | 0.0 /100 | #325 | Tragic 92.8% |
| Central American Indians | 0.0 /100 | #326 | Tragic 92.7% |
| Immigrants | Azores | 0.0 /100 | #327 | Tragic 92.5% |
| Immigrants | Nicaragua | 0.0 /100 | #328 | Tragic 92.5% |
| Immigrants | Cabo Verde | 0.0 /100 | #329 | Tragic 92.4% |
| Immigrants | Armenia | 0.0 /100 | #330 | Tragic 92.3% |
| Hondurans | 0.0 /100 | #331 | Tragic 92.3% |
| Immigrants | Dominican Republic | 0.0 /100 | #332 | Tragic 92.3% |
| Hispanics or Latinos | 0.0 /100 | #333 | Tragic 92.2% |
| Immigrants | Yemen | 0.0 /100 | #334 | Tragic 92.1% |