Basque vs Immigrants from the Azores In Labor Force | Age 30-34
COMPARE
Basque
Immigrants from the Azores
In Labor Force | Age 30-34
In Labor Force | Age 30-34 Comparison
Basques
Immigrants from the Azores
84.0%
IN LABOR FORCE | AGE 30-34
0.9/ 100
METRIC RATING
244th/ 347
METRIC RANK
81.5%
IN LABOR FORCE | AGE 30-34
0.0/ 100
METRIC RATING
316th/ 347
METRIC RANK
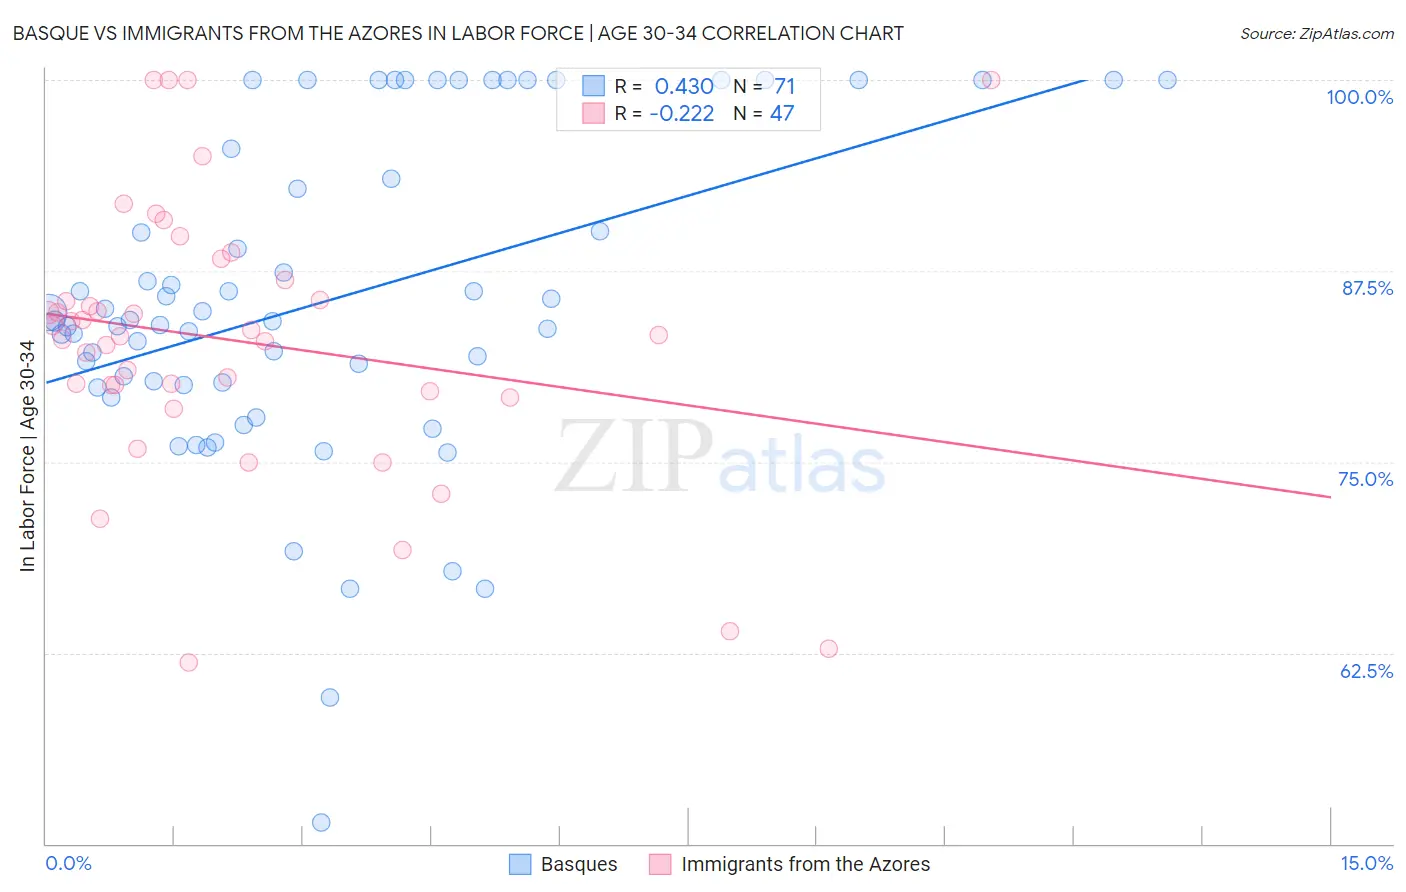
Basque vs Immigrants from the Azores In Labor Force | Age 30-34 Correlation Chart
The statistical analysis conducted on geographies consisting of 165,739,384 people shows a moderate positive correlation between the proportion of Basques and labor force participation rate among population between the ages 30 and 34 in the United States with a correlation coefficient (R) of 0.430 and weighted average of 84.0%. Similarly, the statistical analysis conducted on geographies consisting of 46,256,485 people shows a weak negative correlation between the proportion of Immigrants from the Azores and labor force participation rate among population between the ages 30 and 34 in the United States with a correlation coefficient (R) of -0.222 and weighted average of 81.5%, a difference of 3.1%.
In Labor Force | Age 30-34 Correlation Summary
| Measurement | Basque | Immigrants from the Azores |
| Minimum | 51.4% | 61.9% |
| Maximum | 100.0% | 100.0% |
| Range | 48.6% | 38.1% |
| Mean | 85.6% | 82.9% |
| Median | 84.2% | 83.3% |
| Interquartile 25% (IQ1) | 80.1% | 79.6% |
| Interquartile 75% (IQ3) | 95.5% | 86.9% |
| Interquartile Range (IQR) | 15.4% | 7.3% |
| Standard Deviation (Sample) | 10.7% | 8.8% |
| Standard Deviation (Population) | 10.6% | 8.7% |
Similar Demographics by In Labor Force | Age 30-34
Demographics Similar to Basques by In Labor Force | Age 30-34
In terms of in labor force | age 30-34, the demographic groups most similar to Basques are Immigrants from Venezuela (84.0%, a difference of 0.0%), Central American (84.0%, a difference of 0.0%), British West Indian (84.0%, a difference of 0.020%), Immigrants from Caribbean (84.0%, a difference of 0.030%), and Portuguese (84.0%, a difference of 0.030%).
| Demographics | Rating | Rank | In Labor Force | Age 30-34 |
| Celtics | 1.4 /100 | #237 | Tragic 84.1% |
| Immigrants | Barbados | 1.4 /100 | #238 | Tragic 84.0% |
| English | 1.4 /100 | #239 | Tragic 84.0% |
| Venezuelans | 1.3 /100 | #240 | Tragic 84.0% |
| Immigrants | Portugal | 1.2 /100 | #241 | Tragic 84.0% |
| Immigrants | Oceania | 1.1 /100 | #242 | Tragic 84.0% |
| Immigrants | Caribbean | 1.1 /100 | #243 | Tragic 84.0% |
| Basques | 0.9 /100 | #244 | Tragic 84.0% |
| Immigrants | Venezuela | 0.9 /100 | #245 | Tragic 84.0% |
| Central Americans | 0.9 /100 | #246 | Tragic 84.0% |
| British West Indians | 0.8 /100 | #247 | Tragic 84.0% |
| Portuguese | 0.8 /100 | #248 | Tragic 84.0% |
| Immigrants | Dominica | 0.7 /100 | #249 | Tragic 84.0% |
| Immigrants | Iraq | 0.7 /100 | #250 | Tragic 83.9% |
| Nicaraguans | 0.6 /100 | #251 | Tragic 83.9% |
Demographics Similar to Immigrants from the Azores by In Labor Force | Age 30-34
In terms of in labor force | age 30-34, the demographic groups most similar to Immigrants from the Azores are Arapaho (81.5%, a difference of 0.010%), Choctaw (81.4%, a difference of 0.080%), Shoshone (81.4%, a difference of 0.090%), Yaqui (81.4%, a difference of 0.10%), and Cherokee (81.6%, a difference of 0.15%).
| Demographics | Rating | Rank | In Labor Force | Age 30-34 |
| Immigrants | Mexico | 0.0 /100 | #309 | Tragic 82.0% |
| Cajuns | 0.0 /100 | #310 | Tragic 82.0% |
| Chickasaw | 0.0 /100 | #311 | Tragic 81.9% |
| Mexicans | 0.0 /100 | #312 | Tragic 81.9% |
| Iroquois | 0.0 /100 | #313 | Tragic 81.9% |
| Alaskan Athabascans | 0.0 /100 | #314 | Tragic 81.7% |
| Cherokee | 0.0 /100 | #315 | Tragic 81.6% |
| Immigrants | Azores | 0.0 /100 | #316 | Tragic 81.5% |
| Arapaho | 0.0 /100 | #317 | Tragic 81.5% |
| Choctaw | 0.0 /100 | #318 | Tragic 81.4% |
| Shoshone | 0.0 /100 | #319 | Tragic 81.4% |
| Yaqui | 0.0 /100 | #320 | Tragic 81.4% |
| Alaska Natives | 0.0 /100 | #321 | Tragic 81.3% |
| Puerto Ricans | 0.0 /100 | #322 | Tragic 81.2% |
| Paiute | 0.0 /100 | #323 | Tragic 81.2% |