Barbadian vs Ukrainian In Labor Force | Age 20-64
COMPARE
Barbadian
Ukrainian
In Labor Force | Age 20-64
In Labor Force | Age 20-64 Comparison
Barbadians
Ukrainians
78.8%
IN LABOR FORCE | AGE 20-64
0.7/ 100
METRIC RATING
251st/ 347
METRIC RANK
79.9%
IN LABOR FORCE | AGE 20-64
86.8/ 100
METRIC RATING
135th/ 347
METRIC RANK
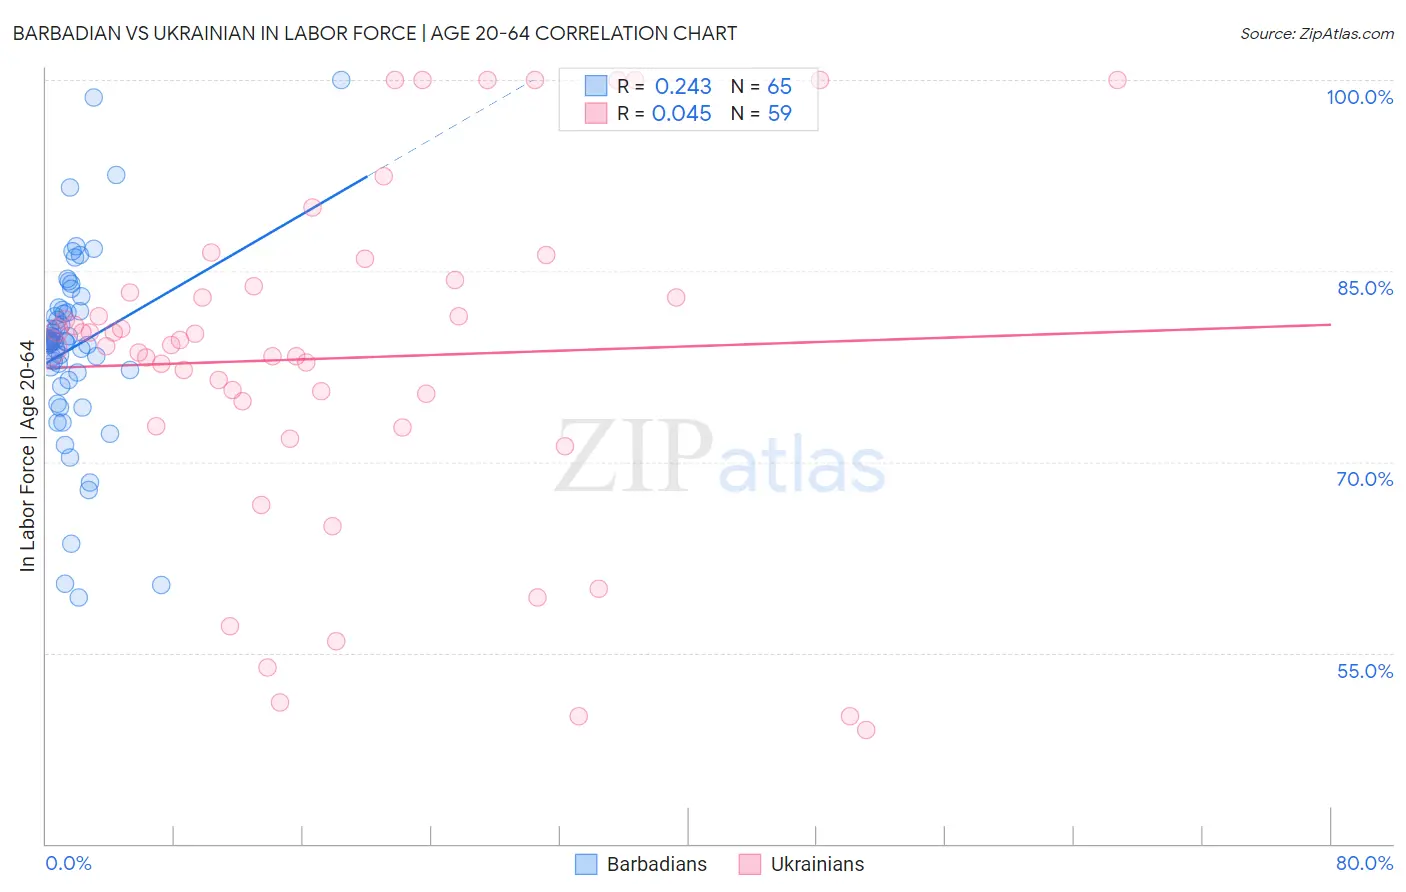
Barbadian vs Ukrainian In Labor Force | Age 20-64 Correlation Chart
The statistical analysis conducted on geographies consisting of 141,304,311 people shows a weak positive correlation between the proportion of Barbadians and labor force participation rate among population between the ages 20 and 64 in the United States with a correlation coefficient (R) of 0.243 and weighted average of 78.8%. Similarly, the statistical analysis conducted on geographies consisting of 448,709,826 people shows no correlation between the proportion of Ukrainians and labor force participation rate among population between the ages 20 and 64 in the United States with a correlation coefficient (R) of 0.045 and weighted average of 79.9%, a difference of 1.4%.
In Labor Force | Age 20-64 Correlation Summary
| Measurement | Barbadian | Ukrainian |
| Minimum | 59.3% | 48.9% |
| Maximum | 100.0% | 100.0% |
| Range | 40.7% | 51.1% |
| Mean | 79.0% | 78.2% |
| Median | 79.4% | 79.2% |
| Interquartile 25% (IQ1) | 76.7% | 72.8% |
| Interquartile 75% (IQ3) | 81.9% | 83.8% |
| Interquartile Range (IQR) | 5.2% | 11.0% |
| Standard Deviation (Sample) | 7.4% | 13.4% |
| Standard Deviation (Population) | 7.4% | 13.3% |
Similar Demographics by In Labor Force | Age 20-64
Demographics Similar to Barbadians by In Labor Force | Age 20-64
In terms of in labor force | age 20-64, the demographic groups most similar to Barbadians are English (78.8%, a difference of 0.030%), Honduran (78.8%, a difference of 0.030%), Immigrants from Honduras (78.7%, a difference of 0.050%), Immigrants from Germany (78.8%, a difference of 0.060%), and Immigrants from Caribbean (78.8%, a difference of 0.060%).
| Demographics | Rating | Rank | In Labor Force | Age 20-64 |
| French | 1.5 /100 | #244 | Tragic 78.9% |
| Scottish | 1.3 /100 | #245 | Tragic 78.9% |
| Immigrants | Trinidad and Tobago | 1.1 /100 | #246 | Tragic 78.8% |
| Immigrants | Germany | 1.0 /100 | #247 | Tragic 78.8% |
| Immigrants | Caribbean | 1.0 /100 | #248 | Tragic 78.8% |
| English | 0.9 /100 | #249 | Tragic 78.8% |
| Hondurans | 0.8 /100 | #250 | Tragic 78.8% |
| Barbadians | 0.7 /100 | #251 | Tragic 78.8% |
| Immigrants | Honduras | 0.6 /100 | #252 | Tragic 78.7% |
| Basques | 0.5 /100 | #253 | Tragic 78.7% |
| Immigrants | Lebanon | 0.5 /100 | #254 | Tragic 78.7% |
| Hawaiians | 0.5 /100 | #255 | Tragic 78.7% |
| Celtics | 0.5 /100 | #256 | Tragic 78.7% |
| Guatemalans | 0.4 /100 | #257 | Tragic 78.7% |
| Immigrants | Guatemala | 0.4 /100 | #258 | Tragic 78.7% |
Demographics Similar to Ukrainians by In Labor Force | Age 20-64
In terms of in labor force | age 20-64, the demographic groups most similar to Ukrainians are Immigrants from Singapore (79.9%, a difference of 0.0%), South American Indian (79.9%, a difference of 0.010%), Belgian (79.9%, a difference of 0.010%), Immigrants from Ukraine (79.9%, a difference of 0.010%), and Immigrants from Nigeria (79.9%, a difference of 0.010%).
| Demographics | Rating | Rank | In Labor Force | Age 20-64 |
| Immigrants | Eastern Asia | 89.4 /100 | #128 | Excellent 79.9% |
| Italians | 88.9 /100 | #129 | Excellent 79.9% |
| Immigrants | Zaire | 88.6 /100 | #130 | Excellent 79.9% |
| Immigrants | Iran | 88.3 /100 | #131 | Excellent 79.9% |
| Indians (Asian) | 87.7 /100 | #132 | Excellent 79.9% |
| South American Indians | 87.6 /100 | #133 | Excellent 79.9% |
| Belgians | 87.4 /100 | #134 | Excellent 79.9% |
| Ukrainians | 86.8 /100 | #135 | Excellent 79.9% |
| Immigrants | Singapore | 86.7 /100 | #136 | Excellent 79.9% |
| Immigrants | Ukraine | 86.5 /100 | #137 | Excellent 79.9% |
| Immigrants | Nigeria | 86.4 /100 | #138 | Excellent 79.9% |
| Immigrants | Spain | 83.9 /100 | #139 | Excellent 79.8% |
| Immigrants | South Eastern Asia | 80.4 /100 | #140 | Excellent 79.8% |
| Immigrants | Israel | 80.0 /100 | #141 | Good 79.8% |
| Slovaks | 79.9 /100 | #142 | Good 79.8% |