Barbadian vs Ugandan 1 or more Vehicles in Household
COMPARE
Barbadian
Ugandan
1 or more Vehicles in Household
1 or more Vehicles in Household Comparison
Barbadians
Ugandans
74.0%
1 OR MORE VEHICLES IN HOUSEHOLD
0.0/ 100
METRIC RATING
335th/ 347
METRIC RANK
88.9%
1 OR MORE VEHICLES IN HOUSEHOLD
8.7/ 100
METRIC RATING
218th/ 347
METRIC RANK
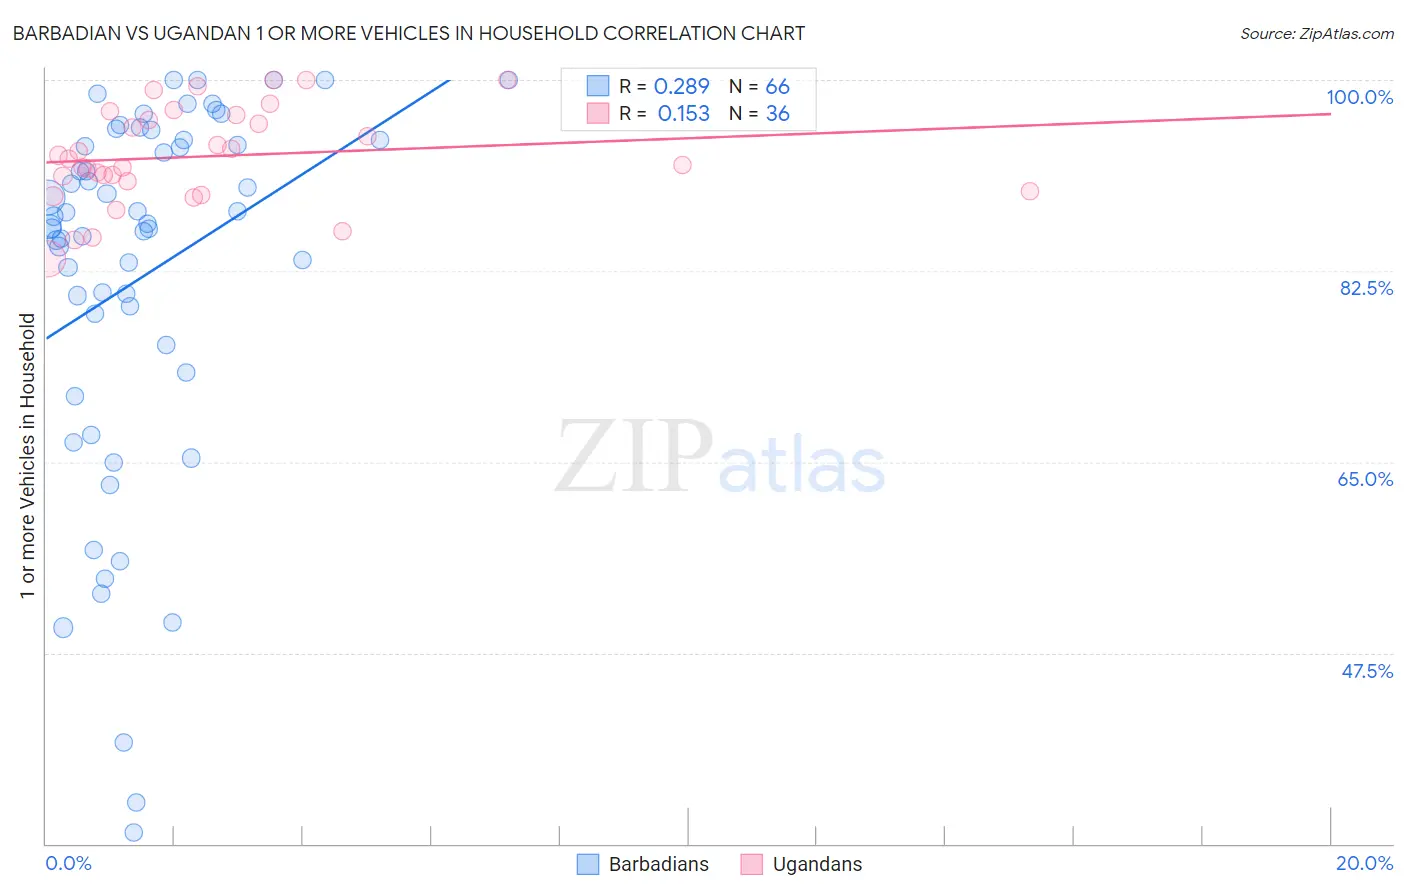
Barbadian vs Ugandan 1 or more Vehicles in Household Correlation Chart
The statistical analysis conducted on geographies consisting of 141,288,849 people shows a weak positive correlation between the proportion of Barbadians and percentage of households with 1 or more vehicles available in the United States with a correlation coefficient (R) of 0.289 and weighted average of 74.0%. Similarly, the statistical analysis conducted on geographies consisting of 93,998,632 people shows a poor positive correlation between the proportion of Ugandans and percentage of households with 1 or more vehicles available in the United States with a correlation coefficient (R) of 0.153 and weighted average of 88.9%, a difference of 20.1%.
1 or more Vehicles in Household Correlation Summary
| Measurement | Barbadian | Ugandan |
| Minimum | 31.0% | 83.6% |
| Maximum | 100.0% | 100.0% |
| Range | 69.0% | 16.4% |
| Mean | 82.0% | 93.0% |
| Median | 86.7% | 92.5% |
| Interquartile 25% (IQ1) | 75.7% | 90.3% |
| Interquartile 75% (IQ3) | 94.5% | 96.6% |
| Interquartile Range (IQR) | 18.8% | 6.3% |
| Standard Deviation (Sample) | 17.0% | 4.4% |
| Standard Deviation (Population) | 16.9% | 4.3% |
Similar Demographics by 1 or more Vehicles in Household
Demographics Similar to Barbadians by 1 or more Vehicles in Household
In terms of 1 or more vehicles in household, the demographic groups most similar to Barbadians are Vietnamese (73.8%, a difference of 0.21%), Immigrants from Bangladesh (74.3%, a difference of 0.44%), Immigrants from Uzbekistan (73.4%, a difference of 0.82%), Immigrants from Ecuador (76.2%, a difference of 3.0%), and Trinidadian and Tobagonian (76.3%, a difference of 3.2%).
| Demographics | Rating | Rank | 1 or more Vehicles in Household |
| Ecuadorians | 0.0 /100 | #328 | Tragic 77.9% |
| Immigrants | Dominica | 0.0 /100 | #329 | Tragic 77.8% |
| Immigrants | Trinidad and Tobago | 0.0 /100 | #330 | Tragic 76.8% |
| West Indians | 0.0 /100 | #331 | Tragic 76.4% |
| Trinidadians and Tobagonians | 0.0 /100 | #332 | Tragic 76.3% |
| Immigrants | Ecuador | 0.0 /100 | #333 | Tragic 76.2% |
| Immigrants | Bangladesh | 0.0 /100 | #334 | Tragic 74.3% |
| Barbadians | 0.0 /100 | #335 | Tragic 74.0% |
| Vietnamese | 0.0 /100 | #336 | Tragic 73.8% |
| Immigrants | Uzbekistan | 0.0 /100 | #337 | Tragic 73.4% |
| Inupiat | 0.0 /100 | #338 | Tragic 71.5% |
| Guyanese | 0.0 /100 | #339 | Tragic 70.8% |
| Dominicans | 0.0 /100 | #340 | Tragic 70.7% |
| Immigrants | Barbados | 0.0 /100 | #341 | Tragic 70.6% |
| Immigrants | Guyana | 0.0 /100 | #342 | Tragic 70.6% |
Demographics Similar to Ugandans by 1 or more Vehicles in Household
In terms of 1 or more vehicles in household, the demographic groups most similar to Ugandans are Immigrants from Guatemala (88.9%, a difference of 0.0%), Argentinean (88.9%, a difference of 0.010%), Immigrants from Zaire (88.8%, a difference of 0.030%), Immigrants from Argentina (88.9%, a difference of 0.040%), and Peruvian (88.8%, a difference of 0.040%).
| Demographics | Rating | Rank | 1 or more Vehicles in Household |
| Sierra Leoneans | 13.0 /100 | #211 | Poor 89.0% |
| Somalis | 12.8 /100 | #212 | Poor 89.0% |
| Immigrants | Western Asia | 12.3 /100 | #213 | Poor 89.0% |
| Immigrants | Hungary | 11.9 /100 | #214 | Poor 89.0% |
| Immigrants | Sri Lanka | 10.2 /100 | #215 | Poor 88.9% |
| Immigrants | Argentina | 9.4 /100 | #216 | Tragic 88.9% |
| Argentineans | 8.8 /100 | #217 | Tragic 88.9% |
| Ugandans | 8.7 /100 | #218 | Tragic 88.9% |
| Immigrants | Guatemala | 8.6 /100 | #219 | Tragic 88.9% |
| Immigrants | Zaire | 8.1 /100 | #220 | Tragic 88.8% |
| Peruvians | 7.9 /100 | #221 | Tragic 88.8% |
| Uruguayans | 7.0 /100 | #222 | Tragic 88.8% |
| Immigrants | South America | 7.0 /100 | #223 | Tragic 88.8% |
| Immigrants | Hong Kong | 6.2 /100 | #224 | Tragic 88.7% |
| Cree | 6.0 /100 | #225 | Tragic 88.7% |