Barbadian vs Ugandan In Labor Force | Age 16-19
COMPARE
Barbadian
Ugandan
In Labor Force | Age 16-19
In Labor Force | Age 16-19 Comparison
Barbadians
Ugandans
31.0%
IN LABOR FORCE | AGE 16-19
0.0/ 100
METRIC RATING
329th/ 347
METRIC RANK
38.9%
IN LABOR FORCE | AGE 16-19
99.3/ 100
METRIC RATING
98th/ 347
METRIC RANK
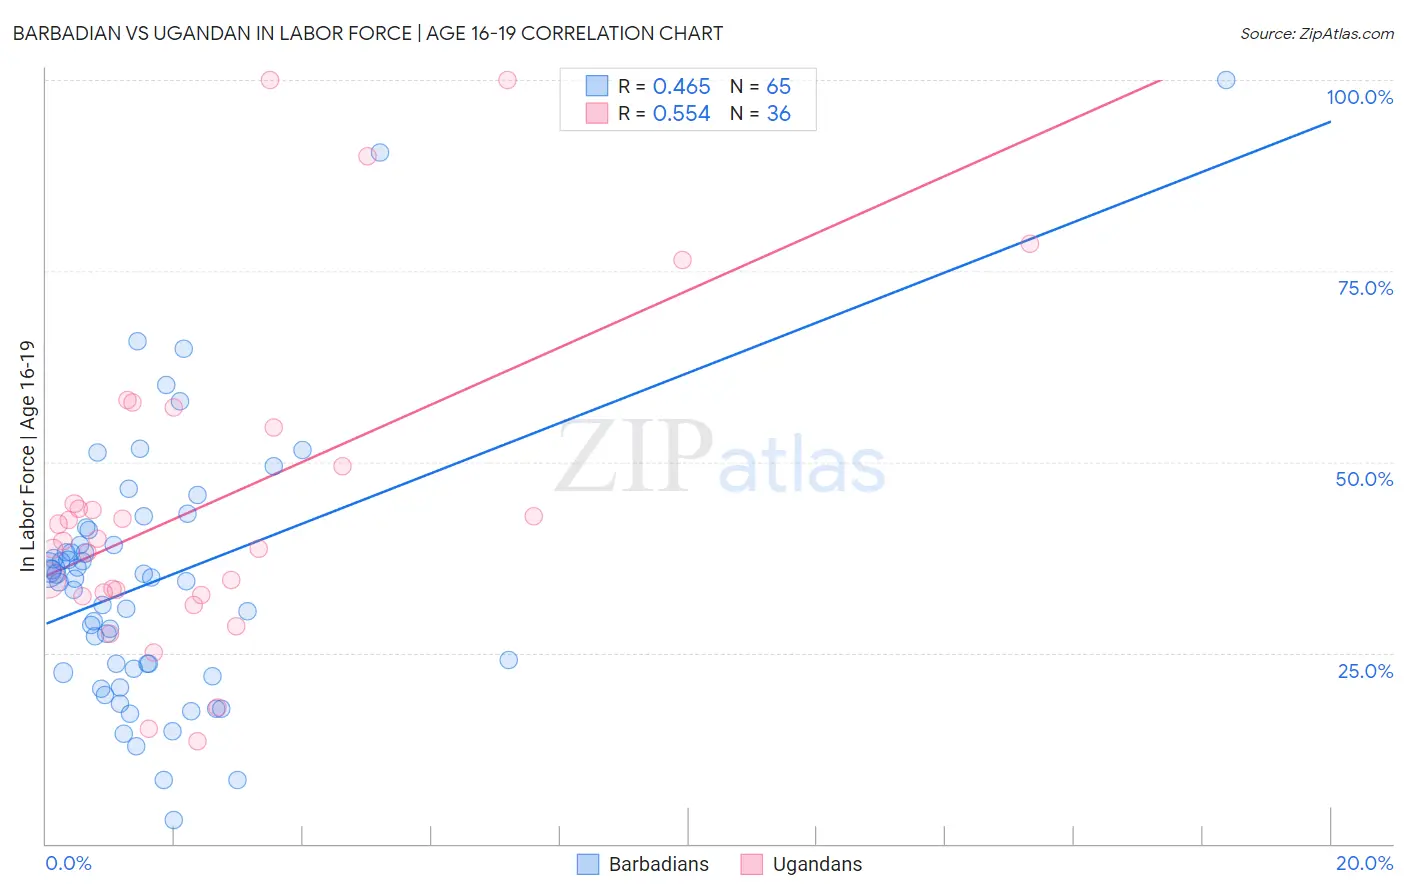
Barbadian vs Ugandan In Labor Force | Age 16-19 Correlation Chart
The statistical analysis conducted on geographies consisting of 141,232,265 people shows a moderate positive correlation between the proportion of Barbadians and labor force participation rate among population between the ages 16 and 19 in the United States with a correlation coefficient (R) of 0.465 and weighted average of 31.0%. Similarly, the statistical analysis conducted on geographies consisting of 94,006,992 people shows a substantial positive correlation between the proportion of Ugandans and labor force participation rate among population between the ages 16 and 19 in the United States with a correlation coefficient (R) of 0.554 and weighted average of 38.9%, a difference of 25.4%.
In Labor Force | Age 16-19 Correlation Summary
| Measurement | Barbadian | Ugandan |
| Minimum | 3.1% | 13.5% |
| Maximum | 100.0% | 100.0% |
| Range | 96.9% | 86.5% |
| Mean | 34.4% | 44.8% |
| Median | 34.6% | 39.8% |
| Interquartile 25% (IQ1) | 22.6% | 32.7% |
| Interquartile 75% (IQ3) | 40.1% | 52.0% |
| Interquartile Range (IQR) | 17.4% | 19.3% |
| Standard Deviation (Sample) | 17.3% | 21.2% |
| Standard Deviation (Population) | 17.1% | 20.9% |
Similar Demographics by In Labor Force | Age 16-19
Demographics Similar to Barbadians by In Labor Force | Age 16-19
In terms of in labor force | age 16-19, the demographic groups most similar to Barbadians are Immigrants from Ecuador (31.0%, a difference of 0.030%), Immigrants from Taiwan (31.0%, a difference of 0.070%), Lumbee (31.0%, a difference of 0.12%), Immigrants from Dominican Republic (31.1%, a difference of 0.23%), and Trinidadian and Tobagonian (30.9%, a difference of 0.27%).
| Demographics | Rating | Rank | In Labor Force | Age 16-19 |
| Tohono O'odham | 0.0 /100 | #322 | Tragic 31.3% |
| Immigrants | Caribbean | 0.0 /100 | #323 | Tragic 31.2% |
| Dominicans | 0.0 /100 | #324 | Tragic 31.2% |
| Immigrants | China | 0.0 /100 | #325 | Tragic 31.1% |
| Immigrants | Dominican Republic | 0.0 /100 | #326 | Tragic 31.1% |
| Immigrants | Taiwan | 0.0 /100 | #327 | Tragic 31.0% |
| Immigrants | Ecuador | 0.0 /100 | #328 | Tragic 31.0% |
| Barbadians | 0.0 /100 | #329 | Tragic 31.0% |
| Lumbee | 0.0 /100 | #330 | Tragic 31.0% |
| Trinidadians and Tobagonians | 0.0 /100 | #331 | Tragic 30.9% |
| Immigrants | Israel | 0.0 /100 | #332 | Tragic 30.5% |
| Immigrants | Hong Kong | 0.0 /100 | #333 | Tragic 30.5% |
| Puerto Ricans | 0.0 /100 | #334 | Tragic 30.3% |
| Immigrants | Cuba | 0.0 /100 | #335 | Tragic 30.2% |
| Immigrants | Trinidad and Tobago | 0.0 /100 | #336 | Tragic 30.2% |
Demographics Similar to Ugandans by In Labor Force | Age 16-19
In terms of in labor force | age 16-19, the demographic groups most similar to Ugandans are Greek (38.9%, a difference of 0.010%), Immigrants from North Macedonia (38.9%, a difference of 0.020%), Latvian (38.9%, a difference of 0.050%), Immigrants from North America (38.9%, a difference of 0.080%), and Blackfeet (38.9%, a difference of 0.17%).
| Demographics | Rating | Rank | In Labor Force | Age 16-19 |
| Spanish Americans | 99.5 /100 | #91 | Exceptional 39.0% |
| Osage | 99.4 /100 | #92 | Exceptional 39.0% |
| Blackfeet | 99.4 /100 | #93 | Exceptional 38.9% |
| Immigrants | Canada | 99.4 /100 | #94 | Exceptional 38.9% |
| Immigrants | North America | 99.4 /100 | #95 | Exceptional 38.9% |
| Latvians | 99.4 /100 | #96 | Exceptional 38.9% |
| Greeks | 99.3 /100 | #97 | Exceptional 38.9% |
| Ugandans | 99.3 /100 | #98 | Exceptional 38.9% |
| Immigrants | North Macedonia | 99.3 /100 | #99 | Exceptional 38.9% |
| Immigrants | Thailand | 99.1 /100 | #100 | Exceptional 38.7% |
| Hmong | 99.1 /100 | #101 | Exceptional 38.7% |
| Zimbabweans | 99.1 /100 | #102 | Exceptional 38.7% |
| Immigrants | Cameroon | 99.0 /100 | #103 | Exceptional 38.7% |
| Immigrants | Eritrea | 99.0 /100 | #104 | Exceptional 38.7% |
| Iraqis | 98.9 /100 | #105 | Exceptional 38.6% |