Barbadian vs Immigrants Disability Age Over 75
COMPARE
Barbadian
Immigrants
Disability Age Over 75
Disability Age Over 75 Comparison
Barbadians
Immigrants
48.0%
DISABILITY AGE OVER 75
6.8/ 100
METRIC RATING
222nd/ 347
METRIC RANK
48.2%
DISABILITY AGE OVER 75
4.3/ 100
METRIC RATING
231st/ 347
METRIC RANK
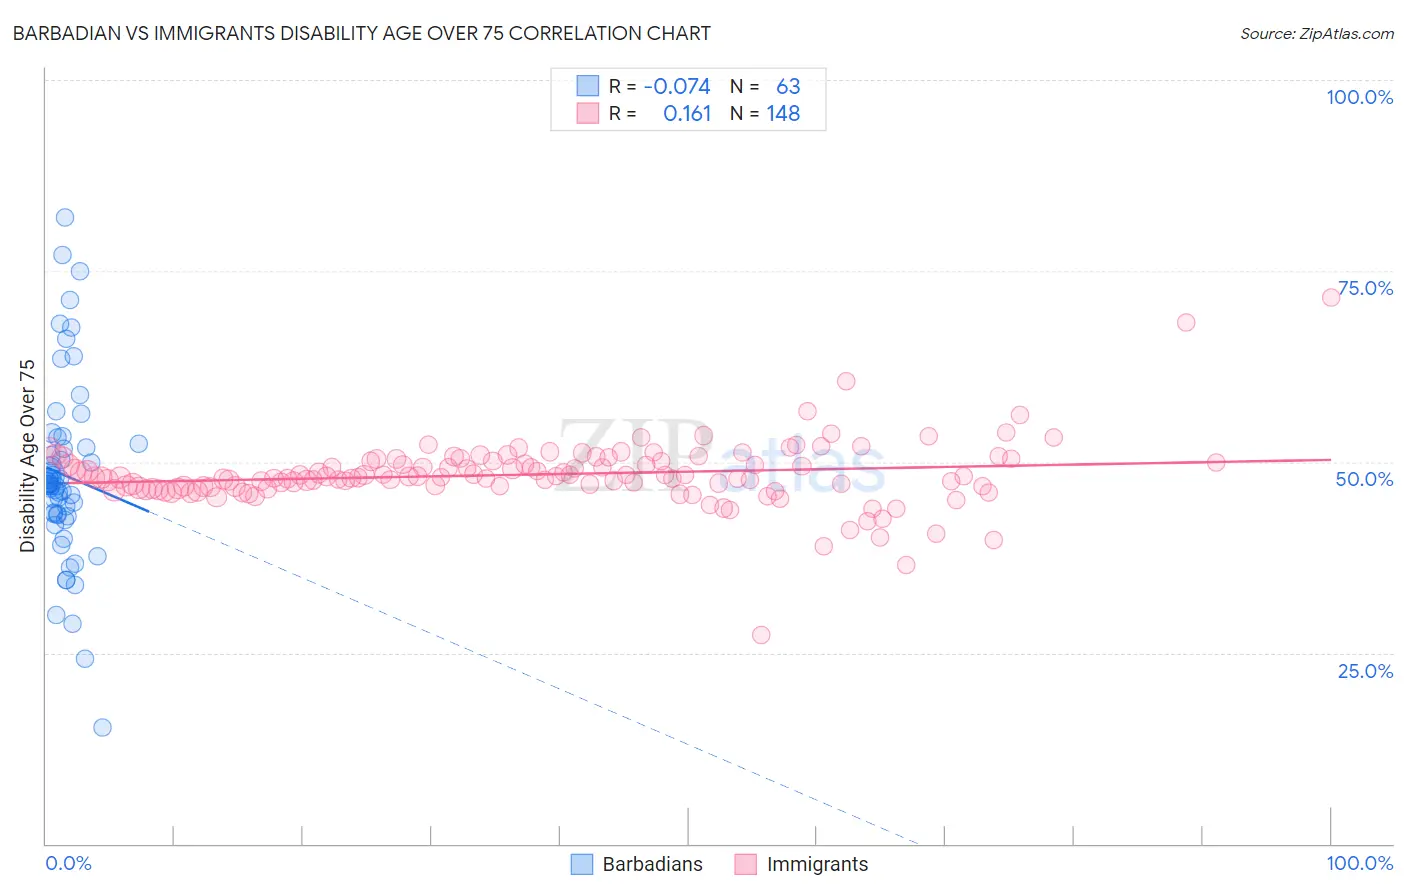
Barbadian vs Immigrants Disability Age Over 75 Correlation Chart
The statistical analysis conducted on geographies consisting of 141,188,611 people shows a slight negative correlation between the proportion of Barbadians and percentage of population with a disability over the age of 75 in the United States with a correlation coefficient (R) of -0.074 and weighted average of 48.0%. Similarly, the statistical analysis conducted on geographies consisting of 575,317,418 people shows a poor positive correlation between the proportion of Immigrants and percentage of population with a disability over the age of 75 in the United States with a correlation coefficient (R) of 0.161 and weighted average of 48.2%, a difference of 0.27%.
Disability Age Over 75 Correlation Summary
| Measurement | Barbadian | Immigrants |
| Minimum | 15.2% | 27.4% |
| Maximum | 82.0% | 71.4% |
| Range | 66.8% | 44.1% |
| Mean | 48.3% | 48.3% |
| Median | 46.9% | 48.0% |
| Interquartile 25% (IQ1) | 43.1% | 46.7% |
| Interquartile 75% (IQ3) | 52.4% | 50.1% |
| Interquartile Range (IQR) | 9.3% | 3.3% |
| Standard Deviation (Sample) | 12.0% | 4.4% |
| Standard Deviation (Population) | 11.9% | 4.4% |
Demographics Similar to Barbadians and Immigrants by Disability Age Over 75
In terms of disability age over 75, the demographic groups most similar to Barbadians are Immigrants from Bangladesh (48.0%, a difference of 0.0%), Liberian (48.0%, a difference of 0.010%), Spanish (48.0%, a difference of 0.030%), Nonimmigrants (48.0%, a difference of 0.030%), and Immigrants from Oceania (48.0%, a difference of 0.040%). Similarly, the demographic groups most similar to Immigrants are Taiwanese (48.2%, a difference of 0.010%), Indonesian (48.2%, a difference of 0.010%), Cree (48.2%, a difference of 0.020%), Subsaharan African (48.2%, a difference of 0.080%), and Hmong (48.2%, a difference of 0.080%).
| Demographics | Rating | Rank | Disability Age Over 75 |
| Immigrants | Panama | 10.2 /100 | #216 | Poor 47.9% |
| Immigrants | Grenada | 9.4 /100 | #217 | Tragic 47.9% |
| Immigrants | Western Africa | 8.3 /100 | #218 | Tragic 48.0% |
| Immigrants | Western Asia | 7.5 /100 | #219 | Tragic 48.0% |
| Bahamians | 7.4 /100 | #220 | Tragic 48.0% |
| Immigrants | Oceania | 7.3 /100 | #221 | Tragic 48.0% |
| Barbadians | 6.8 /100 | #222 | Tragic 48.0% |
| Immigrants | Bangladesh | 6.8 /100 | #223 | Tragic 48.0% |
| Liberians | 6.7 /100 | #224 | Tragic 48.0% |
| Spanish | 6.5 /100 | #225 | Tragic 48.0% |
| Immigrants | Nonimmigrants | 6.5 /100 | #226 | Tragic 48.0% |
| Zimbabweans | 6.4 /100 | #227 | Tragic 48.1% |
| Immigrants | Liberia | 5.9 /100 | #228 | Tragic 48.1% |
| Spaniards | 5.7 /100 | #229 | Tragic 48.1% |
| Taiwanese | 4.4 /100 | #230 | Tragic 48.2% |
| Immigrants | Immigrants | 4.3 /100 | #231 | Tragic 48.2% |
| Indonesians | 4.2 /100 | #232 | Tragic 48.2% |
| Cree | 4.2 /100 | #233 | Tragic 48.2% |
| Sub-Saharan Africans | 3.8 /100 | #234 | Tragic 48.2% |
| Hmong | 3.8 /100 | #235 | Tragic 48.2% |
| Immigrants | Nicaragua | 3.2 /100 | #236 | Tragic 48.2% |