Barbadian vs Immigrants from El Salvador Family Households
COMPARE
Barbadian
Immigrants from El Salvador
Family Households
Family Households Comparison
Barbadians
Immigrants from El Salvador
62.5%
FAMILY HOUSEHOLDS
0.0/ 100
METRIC RATING
294th/ 347
METRIC RANK
67.0%
FAMILY HOUSEHOLDS
100.0/ 100
METRIC RATING
39th/ 347
METRIC RANK
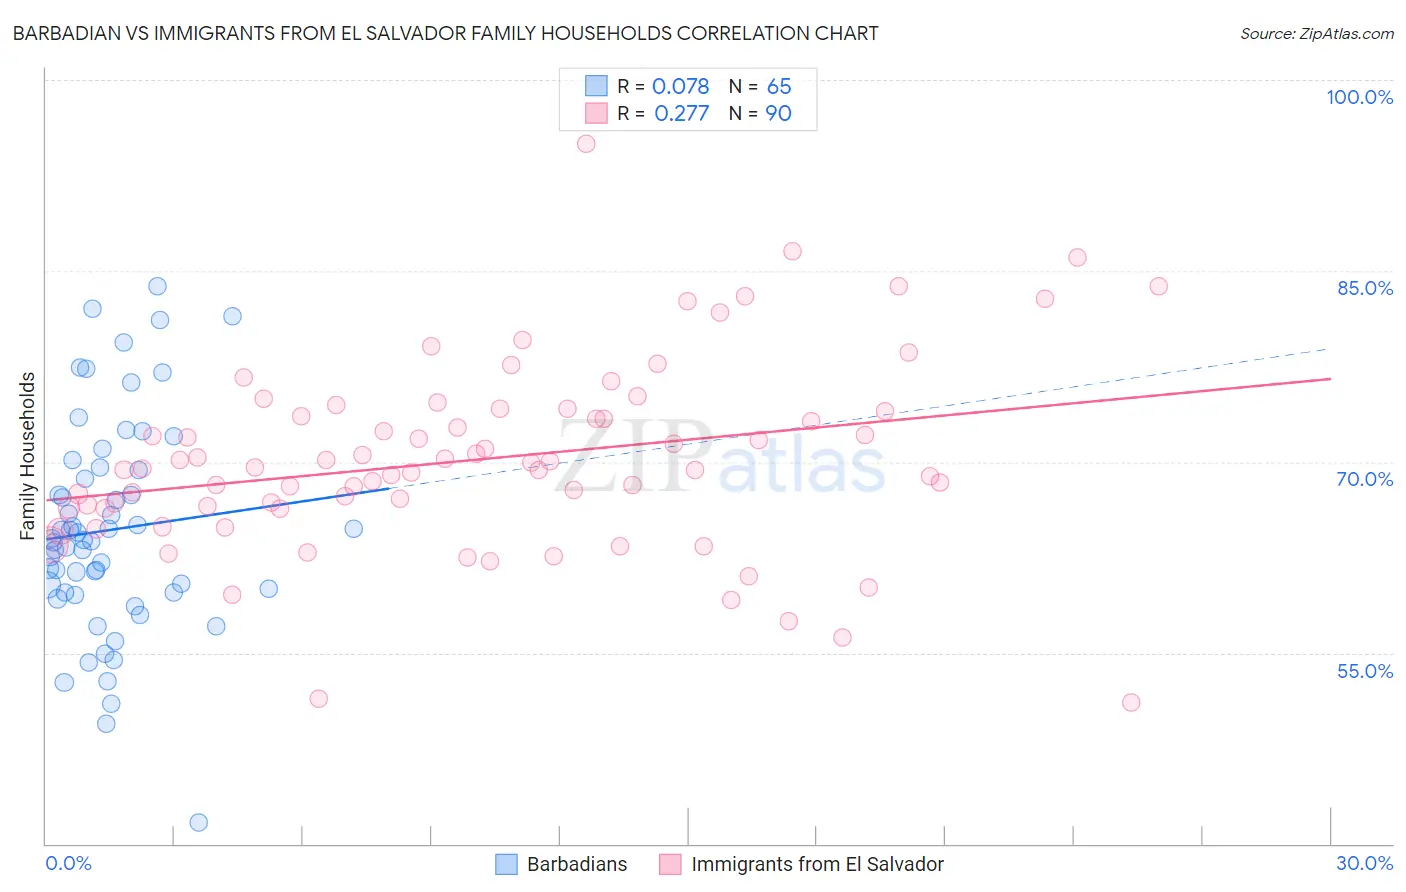
Barbadian vs Immigrants from El Salvador Family Households Correlation Chart
The statistical analysis conducted on geographies consisting of 141,274,787 people shows a slight positive correlation between the proportion of Barbadians and percentage of family households in the United States with a correlation coefficient (R) of 0.078 and weighted average of 62.5%. Similarly, the statistical analysis conducted on geographies consisting of 357,711,776 people shows a weak positive correlation between the proportion of Immigrants from El Salvador and percentage of family households in the United States with a correlation coefficient (R) of 0.277 and weighted average of 67.0%, a difference of 7.3%.
Family Households Correlation Summary
| Measurement | Barbadian | Immigrants from El Salvador |
| Minimum | 41.7% | 51.1% |
| Maximum | 83.8% | 95.0% |
| Range | 42.1% | 43.8% |
| Mean | 64.7% | 70.2% |
| Median | 63.8% | 69.5% |
| Interquartile 25% (IQ1) | 59.8% | 66.4% |
| Interquartile 75% (IQ3) | 69.5% | 73.9% |
| Interquartile Range (IQR) | 9.7% | 7.5% |
| Standard Deviation (Sample) | 8.4% | 7.5% |
| Standard Deviation (Population) | 8.3% | 7.4% |
Similar Demographics by Family Households
Demographics Similar to Barbadians by Family Households
In terms of family households, the demographic groups most similar to Barbadians are Okinawan (62.5%, a difference of 0.010%), Slovene (62.4%, a difference of 0.020%), French American Indian (62.4%, a difference of 0.040%), Immigrants from Sweden (62.5%, a difference of 0.060%), and Immigrants from Spain (62.4%, a difference of 0.060%).
| Demographics | Rating | Rank | Family Households |
| Latvians | 0.1 /100 | #287 | Tragic 62.8% |
| Immigrants | Uganda | 0.1 /100 | #288 | Tragic 62.7% |
| Immigrants | Nepal | 0.1 /100 | #289 | Tragic 62.7% |
| Immigrants | Grenada | 0.0 /100 | #290 | Tragic 62.6% |
| U.S. Virgin Islanders | 0.0 /100 | #291 | Tragic 62.6% |
| Immigrants | Burma/Myanmar | 0.0 /100 | #292 | Tragic 62.6% |
| Immigrants | Sweden | 0.0 /100 | #293 | Tragic 62.5% |
| Barbadians | 0.0 /100 | #294 | Tragic 62.5% |
| Okinawans | 0.0 /100 | #295 | Tragic 62.5% |
| Slovenes | 0.0 /100 | #296 | Tragic 62.4% |
| French American Indians | 0.0 /100 | #297 | Tragic 62.4% |
| Immigrants | Spain | 0.0 /100 | #298 | Tragic 62.4% |
| Immigrants | Kuwait | 0.0 /100 | #299 | Tragic 62.4% |
| Immigrants | Africa | 0.0 /100 | #300 | Tragic 62.4% |
| Immigrants | Albania | 0.0 /100 | #301 | Tragic 62.4% |
Demographics Similar to Immigrants from El Salvador by Family Households
In terms of family households, the demographic groups most similar to Immigrants from El Salvador are Mexican American Indian (67.0%, a difference of 0.020%), Tsimshian (67.1%, a difference of 0.12%), Peruvian (67.1%, a difference of 0.19%), Tohono O'odham (67.1%, a difference of 0.20%), and Salvadoran (67.2%, a difference of 0.25%).
| Demographics | Rating | Rank | Family Households |
| Nepalese | 100.0 /100 | #32 | Exceptional 67.2% |
| Salvadorans | 100.0 /100 | #33 | Exceptional 67.2% |
| Thais | 100.0 /100 | #34 | Exceptional 67.2% |
| Tohono O'odham | 100.0 /100 | #35 | Exceptional 67.1% |
| Peruvians | 100.0 /100 | #36 | Exceptional 67.1% |
| Tsimshian | 100.0 /100 | #37 | Exceptional 67.1% |
| Mexican American Indians | 100.0 /100 | #38 | Exceptional 67.0% |
| Immigrants | El Salvador | 100.0 /100 | #39 | Exceptional 67.0% |
| Guamanians/Chamorros | 100.0 /100 | #40 | Exceptional 66.6% |
| Immigrants | Bolivia | 100.0 /100 | #41 | Exceptional 66.6% |
| Menominee | 100.0 /100 | #42 | Exceptional 66.5% |
| Apache | 100.0 /100 | #43 | Exceptional 66.5% |
| Asians | 100.0 /100 | #44 | Exceptional 66.5% |
| Venezuelans | 100.0 /100 | #45 | Exceptional 66.5% |
| Arapaho | 100.0 /100 | #46 | Exceptional 66.5% |