Bahamian vs Austrian Receiving Food Stamps
COMPARE
Bahamian
Austrian
Receiving Food Stamps
Receiving Food Stamps Comparison
Bahamians
Austrians
17.0%
RECEIVING FOOD STAMPS
0.0/ 100
METRIC RATING
315th/ 347
METRIC RANK
10.0%
RECEIVING FOOD STAMPS
98.6/ 100
METRIC RATING
82nd/ 347
METRIC RANK
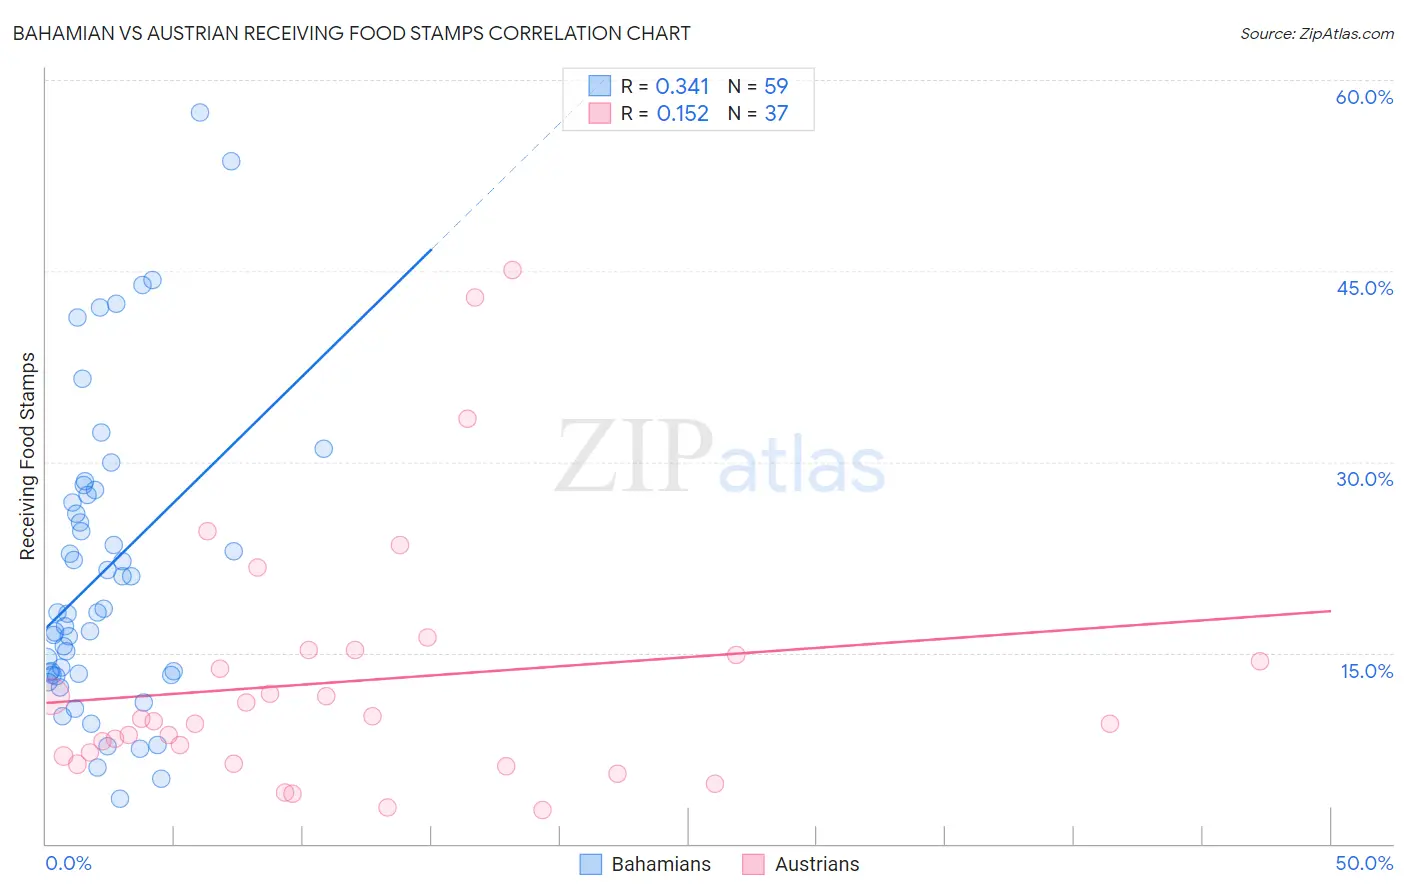
Bahamian vs Austrian Receiving Food Stamps Correlation Chart
The statistical analysis conducted on geographies consisting of 112,602,600 people shows a mild positive correlation between the proportion of Bahamians and percentage of population receiving government assistance and/or food stamps in the United States with a correlation coefficient (R) of 0.341 and weighted average of 17.0%. Similarly, the statistical analysis conducted on geographies consisting of 450,225,937 people shows a poor positive correlation between the proportion of Austrians and percentage of population receiving government assistance and/or food stamps in the United States with a correlation coefficient (R) of 0.152 and weighted average of 10.0%, a difference of 70.0%.
Receiving Food Stamps Correlation Summary
| Measurement | Bahamian | Austrian |
| Minimum | 3.5% | 2.7% |
| Maximum | 57.4% | 45.1% |
| Range | 53.9% | 42.4% |
| Mean | 21.3% | 12.8% |
| Median | 18.1% | 9.7% |
| Interquartile 25% (IQ1) | 13.3% | 6.6% |
| Interquartile 75% (IQ3) | 27.4% | 15.0% |
| Interquartile Range (IQR) | 14.1% | 8.4% |
| Standard Deviation (Sample) | 11.9% | 10.0% |
| Standard Deviation (Population) | 11.8% | 9.8% |
Similar Demographics by Receiving Food Stamps
Demographics Similar to Bahamians by Receiving Food Stamps
In terms of receiving food stamps, the demographic groups most similar to Bahamians are Central American Indian (17.1%, a difference of 0.45%), Immigrants from Guyana (16.9%, a difference of 0.57%), Immigrants from Jamaica (16.9%, a difference of 0.74%), Black/African American (17.2%, a difference of 0.98%), and Sioux (16.8%, a difference of 1.0%).
| Demographics | Rating | Rank | Receiving Food Stamps |
| Barbadians | 0.0 /100 | #308 | Tragic 16.5% |
| U.S. Virgin Islanders | 0.0 /100 | #309 | Tragic 16.5% |
| Immigrants | Barbados | 0.0 /100 | #310 | Tragic 16.6% |
| Guyanese | 0.0 /100 | #311 | Tragic 16.7% |
| Sioux | 0.0 /100 | #312 | Tragic 16.8% |
| Immigrants | Jamaica | 0.0 /100 | #313 | Tragic 16.9% |
| Immigrants | Guyana | 0.0 /100 | #314 | Tragic 16.9% |
| Bahamians | 0.0 /100 | #315 | Tragic 17.0% |
| Central American Indians | 0.0 /100 | #316 | Tragic 17.1% |
| Blacks/African Americans | 0.0 /100 | #317 | Tragic 17.2% |
| Menominee | 0.0 /100 | #318 | Tragic 17.2% |
| Immigrants | St. Vincent and the Grenadines | 0.0 /100 | #319 | Tragic 17.2% |
| Immigrants | Nicaragua | 0.0 /100 | #320 | Tragic 17.2% |
| Natives/Alaskans | 0.0 /100 | #321 | Tragic 17.3% |
| Immigrants | Grenada | 0.0 /100 | #322 | Tragic 17.8% |
Demographics Similar to Austrians by Receiving Food Stamps
In terms of receiving food stamps, the demographic groups most similar to Austrians are Dutch (10.0%, a difference of 0.0%), Immigrants from Israel (10.0%, a difference of 0.070%), Immigrants from England (10.0%, a difference of 0.13%), Immigrants from Romania (10.0%, a difference of 0.25%), and Polish (10.0%, a difference of 0.27%).
| Demographics | Rating | Rank | Receiving Food Stamps |
| Immigrants | Zimbabwe | 98.7 /100 | #75 | Exceptional 9.9% |
| Immigrants | Croatia | 98.7 /100 | #76 | Exceptional 10.0% |
| Immigrants | North Macedonia | 98.7 /100 | #77 | Exceptional 10.0% |
| South Africans | 98.7 /100 | #78 | Exceptional 10.0% |
| Laotians | 98.7 /100 | #79 | Exceptional 10.0% |
| Poles | 98.6 /100 | #80 | Exceptional 10.0% |
| Immigrants | England | 98.6 /100 | #81 | Exceptional 10.0% |
| Austrians | 98.6 /100 | #82 | Exceptional 10.0% |
| Dutch | 98.6 /100 | #83 | Exceptional 10.0% |
| Immigrants | Israel | 98.5 /100 | #84 | Exceptional 10.0% |
| Immigrants | Romania | 98.5 /100 | #85 | Exceptional 10.0% |
| Immigrants | Norway | 98.4 /100 | #86 | Exceptional 10.0% |
| Egyptians | 98.4 /100 | #87 | Exceptional 10.0% |
| Immigrants | Kuwait | 98.4 /100 | #88 | Exceptional 10.0% |
| Immigrants | France | 98.3 /100 | #89 | Exceptional 10.1% |