Bahamian vs Senegalese Receiving Food Stamps
COMPARE
Bahamian
Senegalese
Receiving Food Stamps
Receiving Food Stamps Comparison
Bahamians
Senegalese
17.0%
RECEIVING FOOD STAMPS
0.0/ 100
METRIC RATING
315th/ 347
METRIC RANK
15.4%
RECEIVING FOOD STAMPS
0.0/ 100
METRIC RATING
290th/ 347
METRIC RANK
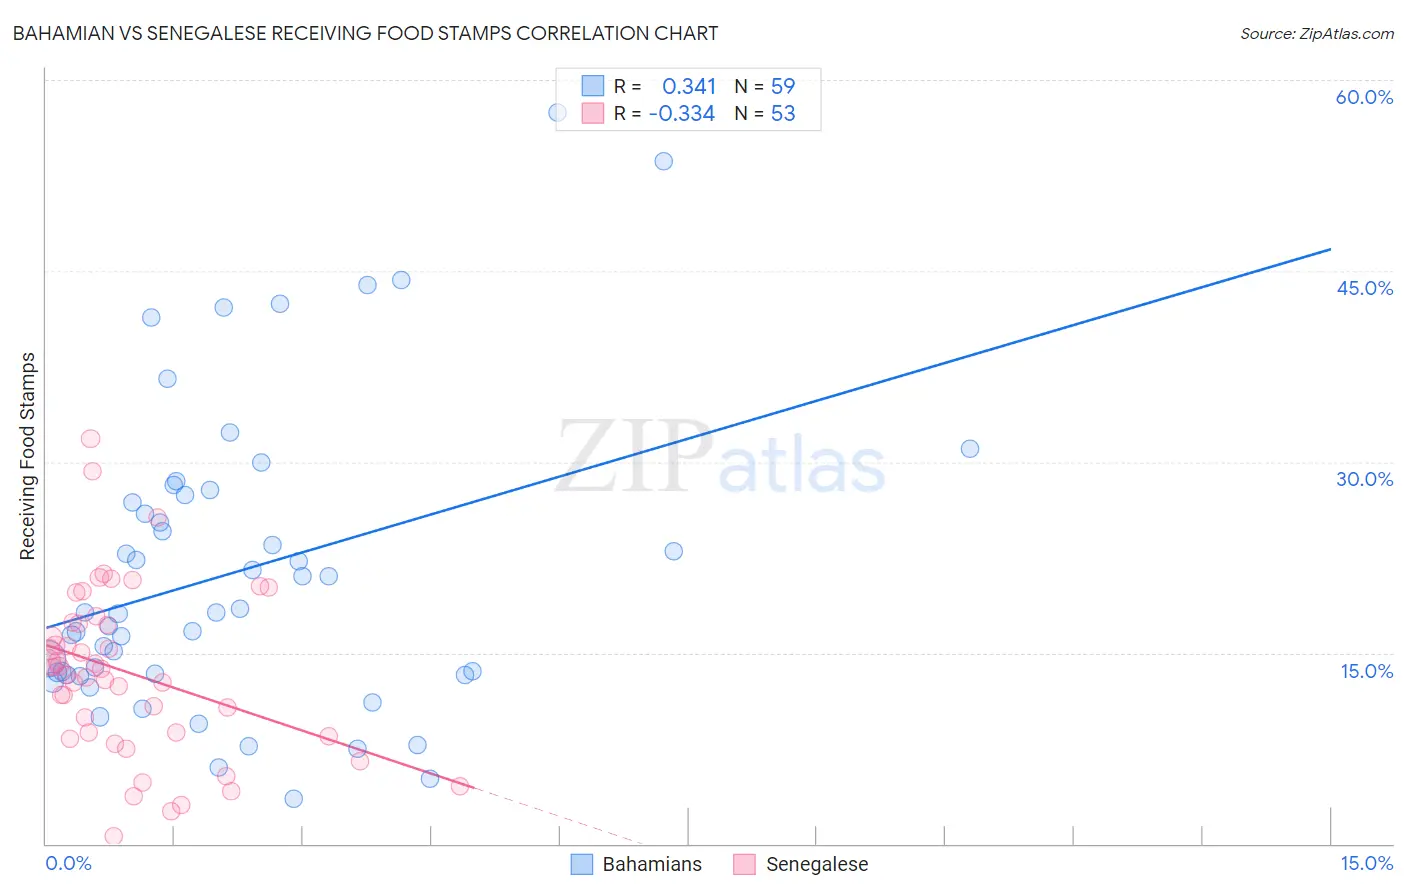
Bahamian vs Senegalese Receiving Food Stamps Correlation Chart
The statistical analysis conducted on geographies consisting of 112,602,600 people shows a mild positive correlation between the proportion of Bahamians and percentage of population receiving government assistance and/or food stamps in the United States with a correlation coefficient (R) of 0.341 and weighted average of 17.0%. Similarly, the statistical analysis conducted on geographies consisting of 78,101,043 people shows a mild negative correlation between the proportion of Senegalese and percentage of population receiving government assistance and/or food stamps in the United States with a correlation coefficient (R) of -0.334 and weighted average of 15.4%, a difference of 10.5%.
Receiving Food Stamps Correlation Summary
| Measurement | Bahamian | Senegalese |
| Minimum | 3.5% | 0.60% |
| Maximum | 57.4% | 31.8% |
| Range | 53.9% | 31.2% |
| Mean | 21.3% | 13.5% |
| Median | 18.1% | 13.7% |
| Interquartile 25% (IQ1) | 13.3% | 8.6% |
| Interquartile 75% (IQ3) | 27.4% | 17.4% |
| Interquartile Range (IQR) | 14.1% | 8.8% |
| Standard Deviation (Sample) | 11.9% | 6.6% |
| Standard Deviation (Population) | 11.8% | 6.5% |
Similar Demographics by Receiving Food Stamps
Demographics Similar to Bahamians by Receiving Food Stamps
In terms of receiving food stamps, the demographic groups most similar to Bahamians are Central American Indian (17.1%, a difference of 0.45%), Immigrants from Guyana (16.9%, a difference of 0.57%), Immigrants from Jamaica (16.9%, a difference of 0.74%), Black/African American (17.2%, a difference of 0.98%), and Sioux (16.8%, a difference of 1.0%).
| Demographics | Rating | Rank | Receiving Food Stamps |
| Barbadians | 0.0 /100 | #308 | Tragic 16.5% |
| U.S. Virgin Islanders | 0.0 /100 | #309 | Tragic 16.5% |
| Immigrants | Barbados | 0.0 /100 | #310 | Tragic 16.6% |
| Guyanese | 0.0 /100 | #311 | Tragic 16.7% |
| Sioux | 0.0 /100 | #312 | Tragic 16.8% |
| Immigrants | Jamaica | 0.0 /100 | #313 | Tragic 16.9% |
| Immigrants | Guyana | 0.0 /100 | #314 | Tragic 16.9% |
| Bahamians | 0.0 /100 | #315 | Tragic 17.0% |
| Central American Indians | 0.0 /100 | #316 | Tragic 17.1% |
| Blacks/African Americans | 0.0 /100 | #317 | Tragic 17.2% |
| Menominee | 0.0 /100 | #318 | Tragic 17.2% |
| Immigrants | St. Vincent and the Grenadines | 0.0 /100 | #319 | Tragic 17.2% |
| Immigrants | Nicaragua | 0.0 /100 | #320 | Tragic 17.2% |
| Natives/Alaskans | 0.0 /100 | #321 | Tragic 17.3% |
| Immigrants | Grenada | 0.0 /100 | #322 | Tragic 17.8% |
Demographics Similar to Senegalese by Receiving Food Stamps
In terms of receiving food stamps, the demographic groups most similar to Senegalese are Immigrants from Senegal (15.3%, a difference of 0.27%), Honduran (15.5%, a difference of 1.0%), Immigrants from Belize (15.2%, a difference of 1.0%), Alaska Native (15.6%, a difference of 1.5%), and Immigrants from Mexico (15.2%, a difference of 1.5%).
| Demographics | Rating | Rank | Receiving Food Stamps |
| Bangladeshis | 0.0 /100 | #283 | Tragic 15.0% |
| Immigrants | Ecuador | 0.0 /100 | #284 | Tragic 15.0% |
| Immigrants | Liberia | 0.0 /100 | #285 | Tragic 15.1% |
| Africans | 0.0 /100 | #286 | Tragic 15.1% |
| Immigrants | Mexico | 0.0 /100 | #287 | Tragic 15.2% |
| Immigrants | Belize | 0.0 /100 | #288 | Tragic 15.2% |
| Immigrants | Senegal | 0.0 /100 | #289 | Tragic 15.3% |
| Senegalese | 0.0 /100 | #290 | Tragic 15.4% |
| Hondurans | 0.0 /100 | #291 | Tragic 15.5% |
| Alaska Natives | 0.0 /100 | #292 | Tragic 15.6% |
| Vietnamese | 0.0 /100 | #293 | Tragic 15.7% |
| Immigrants | Latin America | 0.0 /100 | #294 | Tragic 15.7% |
| Immigrants | Honduras | 0.0 /100 | #295 | Tragic 15.7% |
| Tsimshian | 0.0 /100 | #296 | Tragic 15.7% |
| Immigrants | Bahamas | 0.0 /100 | #297 | Tragic 15.8% |