Bahamian vs Immigrants from Albania Receiving Food Stamps
COMPARE
Bahamian
Immigrants from Albania
Receiving Food Stamps
Receiving Food Stamps Comparison
Bahamians
Immigrants from Albania
17.0%
RECEIVING FOOD STAMPS
0.0/ 100
METRIC RATING
315th/ 347
METRIC RANK
13.0%
RECEIVING FOOD STAMPS
4.4/ 100
METRIC RATING
223rd/ 347
METRIC RANK
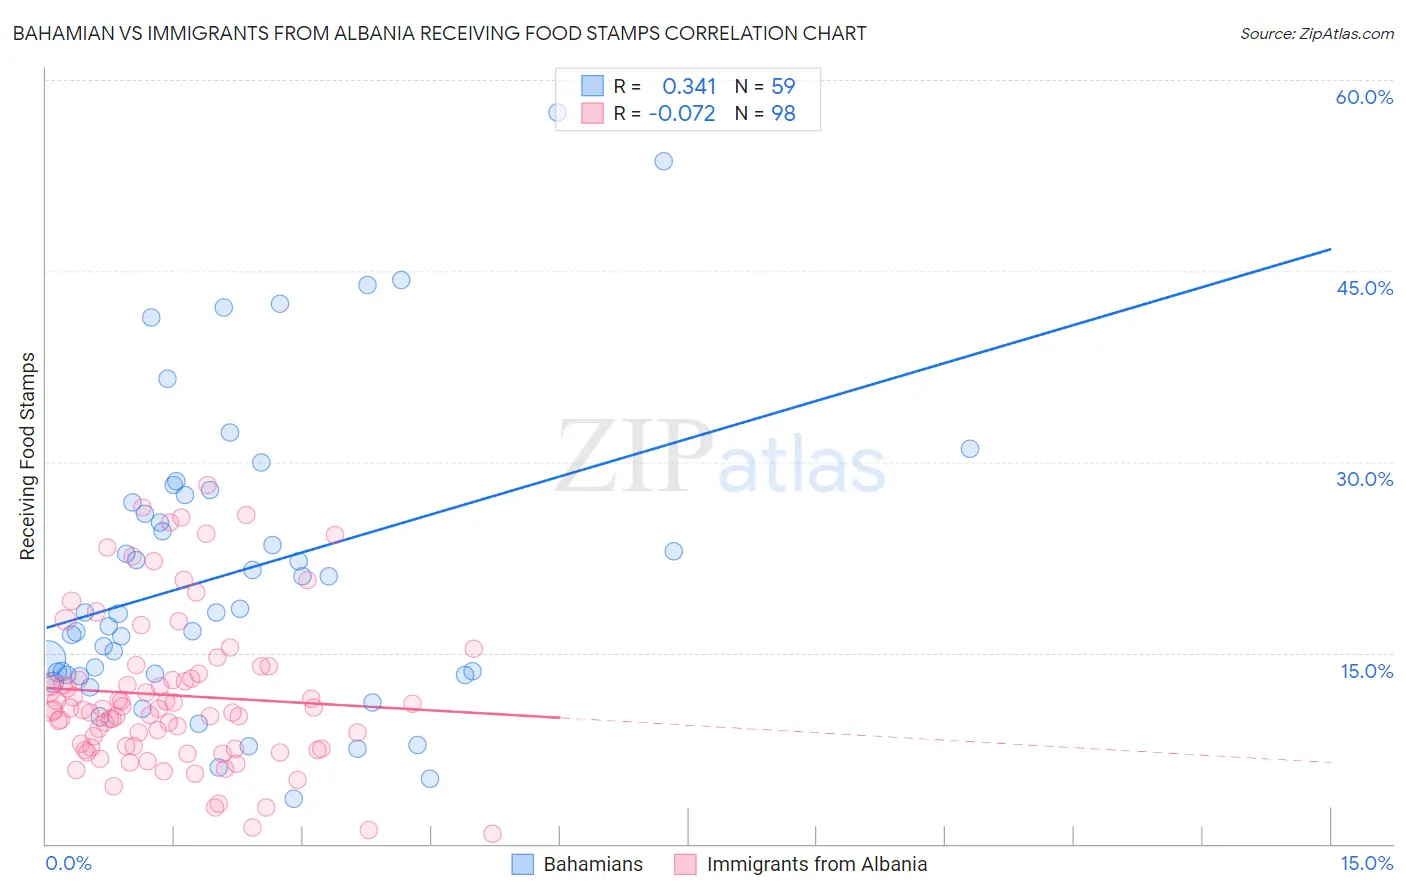
Bahamian vs Immigrants from Albania Receiving Food Stamps Correlation Chart
The statistical analysis conducted on geographies consisting of 112,602,600 people shows a mild positive correlation between the proportion of Bahamians and percentage of population receiving government assistance and/or food stamps in the United States with a correlation coefficient (R) of 0.341 and weighted average of 17.0%. Similarly, the statistical analysis conducted on geographies consisting of 119,244,585 people shows a slight negative correlation between the proportion of Immigrants from Albania and percentage of population receiving government assistance and/or food stamps in the United States with a correlation coefficient (R) of -0.072 and weighted average of 13.0%, a difference of 30.7%.
Receiving Food Stamps Correlation Summary
| Measurement | Bahamian | Immigrants from Albania |
| Minimum | 3.5% | 0.80% |
| Maximum | 57.4% | 28.2% |
| Range | 53.9% | 27.4% |
| Mean | 21.3% | 11.7% |
| Median | 18.1% | 10.6% |
| Interquartile 25% (IQ1) | 13.3% | 7.5% |
| Interquartile 75% (IQ3) | 27.4% | 13.3% |
| Interquartile Range (IQR) | 14.1% | 5.8% |
| Standard Deviation (Sample) | 11.9% | 6.0% |
| Standard Deviation (Population) | 11.8% | 6.0% |
Similar Demographics by Receiving Food Stamps
Demographics Similar to Bahamians by Receiving Food Stamps
In terms of receiving food stamps, the demographic groups most similar to Bahamians are Central American Indian (17.1%, a difference of 0.45%), Immigrants from Guyana (16.9%, a difference of 0.57%), Immigrants from Jamaica (16.9%, a difference of 0.74%), Black/African American (17.2%, a difference of 0.98%), and Sioux (16.8%, a difference of 1.0%).
| Demographics | Rating | Rank | Receiving Food Stamps |
| Barbadians | 0.0 /100 | #308 | Tragic 16.5% |
| U.S. Virgin Islanders | 0.0 /100 | #309 | Tragic 16.5% |
| Immigrants | Barbados | 0.0 /100 | #310 | Tragic 16.6% |
| Guyanese | 0.0 /100 | #311 | Tragic 16.7% |
| Sioux | 0.0 /100 | #312 | Tragic 16.8% |
| Immigrants | Jamaica | 0.0 /100 | #313 | Tragic 16.9% |
| Immigrants | Guyana | 0.0 /100 | #314 | Tragic 16.9% |
| Bahamians | 0.0 /100 | #315 | Tragic 17.0% |
| Central American Indians | 0.0 /100 | #316 | Tragic 17.1% |
| Blacks/African Americans | 0.0 /100 | #317 | Tragic 17.2% |
| Menominee | 0.0 /100 | #318 | Tragic 17.2% |
| Immigrants | St. Vincent and the Grenadines | 0.0 /100 | #319 | Tragic 17.2% |
| Immigrants | Nicaragua | 0.0 /100 | #320 | Tragic 17.2% |
| Natives/Alaskans | 0.0 /100 | #321 | Tragic 17.3% |
| Immigrants | Grenada | 0.0 /100 | #322 | Tragic 17.8% |
Demographics Similar to Immigrants from Albania by Receiving Food Stamps
In terms of receiving food stamps, the demographic groups most similar to Immigrants from Albania are Immigrants (13.0%, a difference of 0.040%), Immigrants from Armenia (13.0%, a difference of 0.070%), Fijian (13.0%, a difference of 0.090%), Bermudan (13.0%, a difference of 0.30%), and Immigrants from Colombia (12.9%, a difference of 0.62%).
| Demographics | Rating | Rank | Receiving Food Stamps |
| Immigrants | South America | 6.5 /100 | #216 | Tragic 12.8% |
| Immigrants | Burma/Myanmar | 6.0 /100 | #217 | Tragic 12.9% |
| Hawaiians | 5.4 /100 | #218 | Tragic 12.9% |
| Immigrants | Middle Africa | 5.4 /100 | #219 | Tragic 12.9% |
| Immigrants | Colombia | 5.3 /100 | #220 | Tragic 12.9% |
| Bermudans | 4.8 /100 | #221 | Tragic 13.0% |
| Immigrants | Immigrants | 4.4 /100 | #222 | Tragic 13.0% |
| Immigrants | Albania | 4.4 /100 | #223 | Tragic 13.0% |
| Immigrants | Armenia | 4.3 /100 | #224 | Tragic 13.0% |
| Fijians | 4.3 /100 | #225 | Tragic 13.0% |
| Chickasaw | 3.6 /100 | #226 | Tragic 13.1% |
| Nigerians | 3.5 /100 | #227 | Tragic 13.1% |
| Panamanians | 3.5 /100 | #228 | Tragic 13.1% |
| Ottawa | 3.5 /100 | #229 | Tragic 13.1% |
| Puget Sound Salish | 3.4 /100 | #230 | Tragic 13.1% |